
Tussle between Attractive Micros and Challenging Geopolitical Factors

Geopolitical friction dictates short-term volatility, but corporate earnings and reasonable valuations govern long-term equity returns. Despite headwinds from Middle East tensions, high oil prices, a softer currency, and foreign selling, corporate fundamentals remain resilient with broad-based profit beats and upward estimate revisions. With key indices trading at a discount to historical averages and robust domestic inflows buffering against primary market liquidity absorption, periodic pullbacks offer a prime opportunity to accumulate quality earnings compounders.
Geopolitics are noise. Earnings are the real signal for a long-term investor.
Key takeaways
- Micros are holding up: In Q1FY27, 57% of HSLIE (HDFC Securities Institutional equities)-covered companies beat PAT estimates – a 10-quarter high – and aggregate PAT beat previews by 11.1%. Estimates were nudged up (+0.1% FY27E, +0.7% FY28E) after the previous quarter’s cuts, leaving projected coverage earnings growth of 14.2% in FY27E and 15.4% in FY28E.
- Valuations remain below average: Nifty trades at ~19.1x FY27E vs a 10-year Average of 20.4x.
- Geopolitics are the headwind: US – Iran hostilities, the Houthis’ progress in Yemen and related disruptions have pushed Brent crude to ~$102 (+49% YoY, pressuring the INR at ~96/$ and contributing to ₹69 lakh crore of FII cash-market selling in CY 2026. A ~15% monsoon deficit and the US 10-year yield at 5.12%, its highest since 2007, are other factors to watch out for.
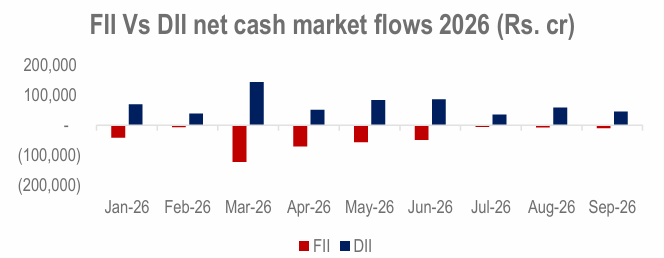
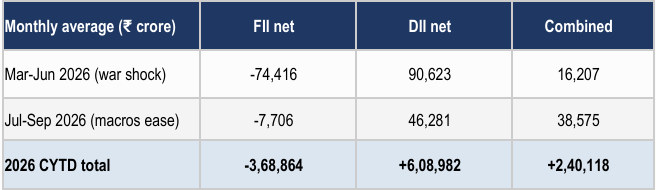
- Flows: FII cash-market selling shrank from ~₹74,000 cr a month in Mar-Jun to ~₹7,000 cr in Jul-Sep as conditions eased; DII buying has moderated to ~₹44,000 cr a month but remains firmly positive. Supply through IPO/OFS is a risk to watch out for: the NSE (₹22,569 crore) and Jio (₹37,700 crore) IPOs, along with others, will absorb liquidity.
- Our stance: Geopolitics sets the mood in the short term; earnings and valuations set the returns over the long term. Use geopolitics-driven volatility to accumulate quality earnings compounders.
-
Source: HSLIE, Moneycontrol, Investing
The tussle in brief
Indian equities are caught between two opposing forces. At the company level, delivery has been resilient: the beat rate is at a 10-quarter high, estimate revisions have turned positive after a quarter of cuts, and valuations sit below their long-term averages. On the geopolitical front, the backdrop is challenging: the US-Iran war has kept crude near $100 a barrel, Houthis progress in Yemen adds another potential risk, the rupee is hovering close to record lows, foreign investors have sold ₹3.69 lakh crore of Indian equities in the cash market so far this year, the monsoon is heading for its weakest outcome since 2009, and both the US Federal Reserve and potentially the RBI are tightening policy.
This note lays out both sides of the ledger and argues that, while geopolitics typically dominates price action in the short run, it is the earnings trajectory and the price paid for it that determine long-term returns.
Attractive Micros
Earnings: resilient delivery, with OMCs the one drag
Q1FY27 was a healthy quarter despite the war. Across the HSIE coverage universe of ~275 stocks, ex-OMCs, aggregate revenue grew 18% YoY while PAT grew 19%, even as losses at oil marketing companies (which absorbed the crude spike) pulled down aggregate PAT growth to 5%.
Key points from the flipbook:
- Aggregate PAT beat preview estimates by 11.1%, led by energy, autos, lenders, chemicals and metals. 57% of covered companies beat PAT estimates – a 10-quarter high.
- Earnings Growth was even across market caps (ex-OMCs): large caps grew 18.5% YoY, mid-caps 19.1% and small caps 18.4%, against 10.5%/36%/23.7% in Q4FY26.
- Double-digit YoY earnings growth came from lenders, capital markets, consumer discretionary, defence, real estate, IT, home improvement, chemicals, metals and telecom. Oil & gas, staples, industrials, pharma and cement were subdued.
- Estimate trajectory: coverage earnings are projected to grow 14.2% in FY27E and 15.4% in FY28E. The exceptional 18% CAGR of FY19-24 normalises to ~11.3% over FY24-28E, with BFSI, autos, metals, industrials and pharma driving the ex-oil & gas outlook.

Share of HSIE-covered companies beating PAT estimates. Source: HSIE Research 1QFY27 Quarterly Flipbook.
Few downgrades this quarter. Lenders, metals and chemicals drove aggregate earnings upgrades, while most other sectors saw only marginal trims; OMCs led the oil & gas downgrades. Net, coverage estimates were revised up 0.1% for FY27E and 0.7% for FY28E – a reversal of the 2.9%/2.7% cuts made after Q4FY26, which HSIE reads as gradually reviving optimism after the Middle East war shock.
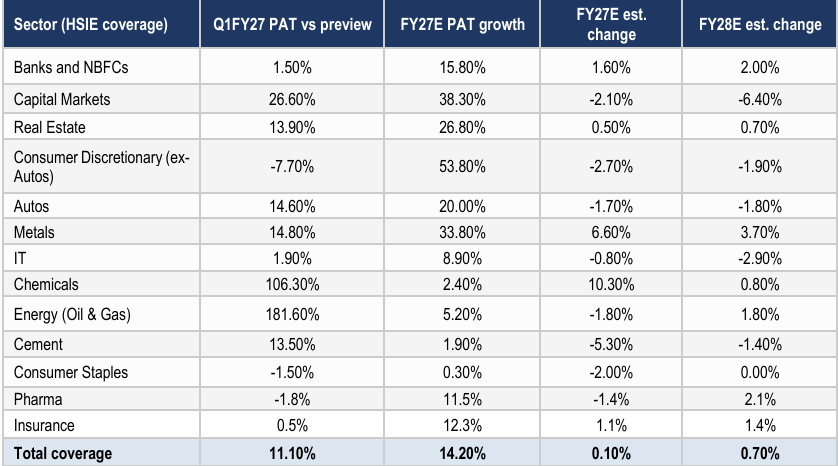
Source: HSIE Research 1QFY27 Quarterly Flipbook, 21 August 2026. Estimate changes are relative to Q4FY26. FY28E coverage PAT growth: 15.4%.
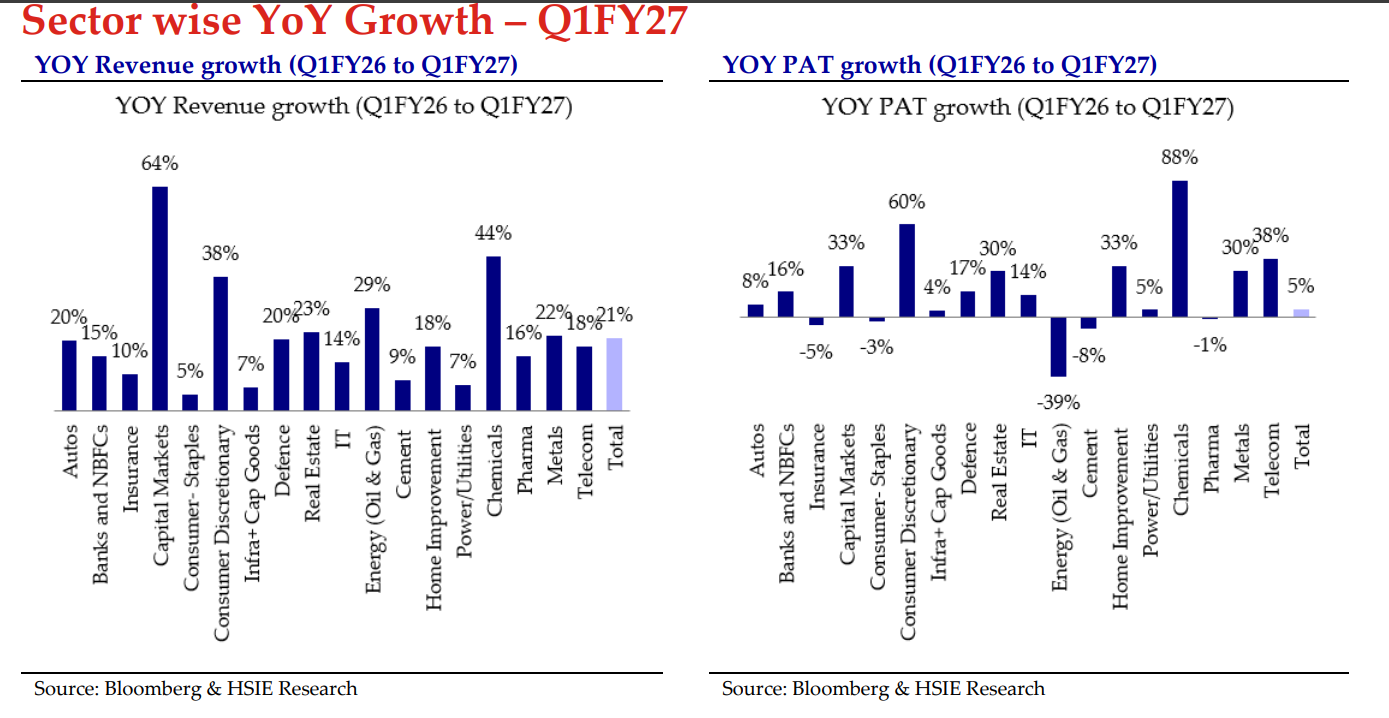
Source: HSIE Research
Valuations: a discount to history
Prices have lagged earnings, so the market is cheaper than it was a year ago even as profits have risen. HSIE estimated EPS, the Nifty 50 is trading at ~19.1x FY27E. On a trailing basis the Nifty P/E currently is at 21.1 against a 10-year median of 23.10, with price to book at 2.9 against 10-year median of 3.2. On a trailing basis the Nifty Smallcap 250 P/E currently is ~32.2x, about 14.1% above its 10-year Median of ~29.2x, with the price-to-book at 3.51 against a 10-year median of 2.61. On a trailing basis the Nifty Midcap 150 P/E currently is ~31.8x, about 3.4% below its 10-year median of ~32.9x, with the price-to-book at 4.1 against a 10-year median of 3.1. (Source: Bloomberg)

Source: Bloomberg, HDFC TRU. Note: (1) Priced as of 23September, 2026
Importantly, this de-rating has come with earnings moving the other way. When prices lag while earnings rise, the market becomes cheaper for the right reason. Earnings growth of 14.2% in FY27E and 15.4% in FY28E implies that, earnings power would be roughly 32% higher in aggregate by FY28E.
Indian Equity Indices Valuation Snapshot

Source: Bloomberg, HDFC TRU. Note: (1) Priced as of 23September, 2026; (2) The 12M fwd. P/E is calculated using the 12M Blended Fwd. EPS.
Rolling Returns Historical Analysis
Historically, whenever the Sensex delivers stagnant, low single-digit returns over a two-year period, it suggests that large-cap valuations have time-corrected and investor pessimism has likely peaked. This phase of underperformance frequently clears the way for “mean reversion” where the following 12 months see outsized gains as earnings growth catches up to price.
Low 2-year Rolling Sensex returns = Strong next 12-month Upside…
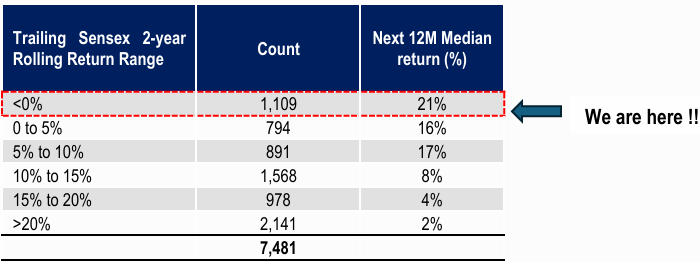
Source: ACE MF, Investing, HDFC TRU. Data Period: 1 Apr-2005 to 23 Sept-2026
Challenging Geopolitics
The table below summarises where the key macro variables stand today and the outlook going forward. While crude oil has risen and inflation is rising, the most important variable – GDP growth – continues to be strong. Further, the RBI’s initiatives in attracting FCNR (B) deposits should help stabilise the currency.
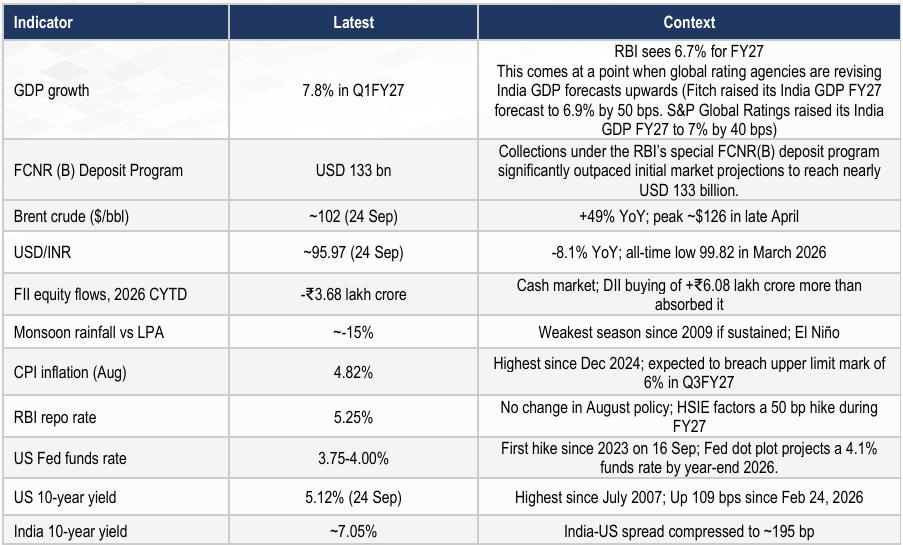
Sources: MoSPI; Trading Economics; Moneycontro; IMD; RBI; HSIE Research; CNBC, Business Standard
US–Iran war → crude → rupee → FII flows
This is the dominant transmission chain for Indian markets today.
- Crude: Brent touched ~$126 in late April, its highest since June 2022, eased over the summer, and closed above $101 on 9 September – its highest since May – as US-Iran strikes escalated in the Persian Gulf. It was ~$102 on 24 September, about 49% higher YoY, swinging with the progress of US-Iran negotiations and Saudi efforts to restore pipeline exports.
- USD – INR: Higher crude widens the import bill and the current account deficit. At ~95.97/$ on 24 September the rupee is ~8.1% weaker YoY, and it briefly breached 96 last week (all-time low: 99.82 in March 2026). RBI intervention and balance-of-payments measures (~USD 133 billion FCNR(B) deposits raised) have limited the damage.
- FII flows: Weakening INR in turn weakens FII sentiment towards India as their returns in USD are negatively impacted. This prompts higher outflows further pressuring INR.
The micro impact of this chain is visible in HSIE’s estimates: OMCs dragged headline Q1FY27 PAT growth down to 5%, from 19% ex-OMCs, and led the oil & gas downgrades, while upstream names such as OIL and IOCL were upgraded. HSIE continues to flag OMCs as the key downside risk to aggregate earnings from war-driven crude volatility.
Monsoon deficit and inflation
- Rainfall: The June-September monsoon deficit reached 13.8% by end-August – the warmest August since 1901 – and IMD expected September rainfall below 91% of LPA. By mid-September the cumulative deficit was ~15%, on track for the weakest monsoon since 2009, amid a strengthening El Niño. HSIE lists monsoon intensity among its key monitorables for earnings, with a sub-par season already flagged as a risk for rural demand.
- Inflation: CPI inflation rose to 4.82% in August, its highest since December 2024, with food inflation at 5.95% as energy costs fed through from the war and the weaker rupee. HSIE flags crude volatility, inflationary pressure and monsoon intensity as the key monitorables for earnings.
- Earnings angle: A weak kharif harvest would weigh on rural consumption (tractors, two-wheelers, FMCG) and keep input costs elevated for companies already absorbing crude-linked inflation.
US 10-year yields and domestic rate hikes
- US: The Fed raised rates by 25 bp to 3.75-4.00% on 16 September, its first hike since 2023, as war-driven energy prices fed into inflation. Market expects a further 25 bps rate hike by CY2026-end. The US 10-year yield has since pushed higher still, to 5.12% on 24 September – its highest since July 2007.
- India: With the India 10-year at ~7.05%, the India-US yield spread has compressed to ~195 bp, reducing the carry that attracts foreign debt capital. The RBI held the repo rate at 5.25% in August and currently October looks live from rate hike perspective but improved growth forecasts by these rating agencies might help RBI deliver a more data dependent hike in December and beyond for 50-75 bps.
Flows: FII, DII and the supply of paper
FII selling slowed sharply as conditions improved
FII selling in 2026 has closely tracked the macro cycle. Selling peaked in March (₹1.23 lakh crore in the cash market), when the war began and Brent spiked, and averaged ~₹74,000 crore a month over March-June. As crude fell back towards ~$70 by early July and a US-Iran pause took hold in late July, FII selling dropped sharply to ~₹5,800 crore in July and ~₹7,500 crore in August – barely a tenth of the earlier pace.
September shows how quickly this can reverse: with Brent back above $100 and US yields above 5%, FIIs have sold ~₹9,800 crore in the cash market month-to-date. Even so, the pace is a fraction of the March-June exodus, and cumulative FII cash selling of ~₹3.68 lakh crore in 2026 means foreign positioning in India is already light.
DII buying has moderated but stays firmly positive
Domestic institutions have absorbed every rupee of FII selling and more. DIIs bought ~₹6.0 lakh crore in the cash market in 2026 so far – not a single month of net selling. The pace has moderated from ~₹90,600 crore a month in March-June to ~₹44,100 crore a month in July-September. The engine behind this is structural: equity mutual fund inflows rose 19% MoM to ₹29,329 crore in August, a four-month high. This is the savings-to-equity shift at work, and it gives the Indian market a floor it did not have in past geopolitical shocks.
Source: FII/DII activity Moneycontrol. *September till 23rd September 2026.
Source: Moneycontrol monthly FII/DII cash-market data. Sep 2026 is month-to-date.
Supply of paper will absorb market liquidity
While demand from domestic investors is steady, the supply of equity paper has risen sharply:
- Primary pipeline: In January-August 2026, mainboard IPOs raised ₹73,674 crore across 62 issues and SME IPOs a further ₹5,739 crore across 126 issues – ₹79,413 crore in all. The NSE issue takes 2026 IPO fundraising past ₹1 lakh crore for the third straight year, and 159 companies hold SEBI approval but have yet to announce dates. Including QIPs and OFS, Jan to August alone saw ~₹93 lakh crore raised –
Why it matters. Together, the NSE and Jio issues alone will absorb ~₹60,000 crore – more than a month of DII buying at the recent pace of ~₹44,000 crore. Money raised through large IPOs, particularly an offer for sale, is often funded by trimming existing holdings. As a result, secondary-market stocks can lag even when domestic inflows are healthy.
Short term: geopolitics dominates; Long term: earnings decide.
September 2026 is a textbook illustration of the tussle. Q1FY27 delivered the highest beat rate in 10 quarters and the first estimate upgrades in a year, yet FIIs turned sellers again within weeks as crude, the rupee and US yields moved against India – and a heavy IPO calendar is competing for domestic money. Over weeks and months, price action is driven by flows, and flows are driven by geopolitics and by supply.
Over years, the arithmetic is different. Index returns are the product of earnings growth and the change in the valuation multiple. With coverage earnings compounding at 14.2% in FY27E and 15.4% in FY28E and the Nifty starting from a below-average multiple, the long-term investor has both variables working in their favour. Geopolitical shocks – oil spikes, currency slides, rate cycles and poor monsoons – tend to be episodic; earnings compounding is persistent.
Positioning
HSIE’s view is that stock-specific, bottom-up ideas – rather than index or sector calls – hold the key to outperformance. Preferred sectors are financials, autos, industrials, pharma, real estate, chemicals and consumer discretionary; HSIE remains underweight energy, cement and telecom. In the August rebalancing of its model portfolio, sector weights were left unchanged and the stocks within them were realigned towards better earnings delivery.
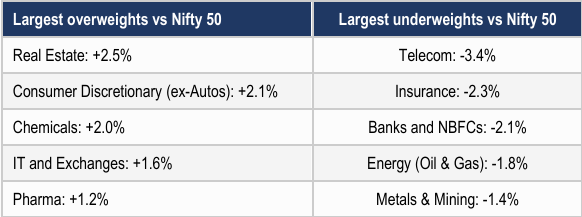
HSIE Multi-Cap Model Portfolio sector weights relative to Nifty 50, August 2026 rebalancing. Source: HSIE Research.
Bottom line: Geopolitics are noise. Earnings are the real signal for a long-term investor.
Investors should think in terms of years or even decades rather than weeks or months. Over the longer investment horizon, earnings growth matters more. Investors who are able to tune out the current geopolitical noise and focus on the long term are likely to benefit out of the present market weakness.






 2024 HDFC TRU