India's Home Services Market: A Snapshot

The Indian home services market is a rapidly growing sector with a total addressable market of around $60 billion in FY2025. This traditionally unorganized industry is undergoing a significant digital transformation, with online platforms gaining traction and offering a superior customer experience. The market’s growth is being driven by urbanization and busier lifestyles, and it is projected to reach approximately $100 billion by FY2030.
Executive Summary:
- The Indian home services market is a rapidly expanding sector, valued at ₹5,100–5,210 billion (~US$60 billion) Total Addressable Market (TAM) in FY2025. This market is projected to grow at a 10-11% CAGR, reaching ₹8,400–8,580 billion (~US$100 billion) by FY2030, driven by urbanization and busier lifestyles.
- Traditionally unorganized, this market is seeing a rise in technology-driven platforms that standardize services and offer a superior customer experience.
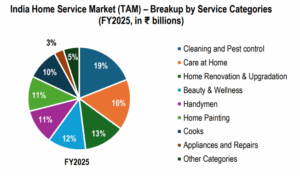
Key Market Segments
The home services market is broadly categorized into Beauty & Wellness, Home Repair & Maintenance, and Other Categories. Each segment has distinct growth drivers and market dynamics.
Source: Urbancompany RHP, Redseer Research, HDFC TRU.
Consumption Patterns by Household Type
- The usage of home services in India varies significantly based on income levels, family structures, and lifestyle preferences.
- High-income households exhibit a high frequency of service usage across categories like beauty, cleaning, and handyman services, reflecting their greater disposable income and prioritization of convenience and well-maintained living spaces. These households also frequently opt for appliance maintenance and home repainting every 3–5 years.
- Middle-income households are more budget-conscious, leading to a lower frequency of beauty and maintenance services.
- Low-income households are in the early adoption stage and tend to use low-skilled, affordable local providers. Their use of beauty services is minimal and typically for special occasions, and major home maintenance like painting occurs infrequently, often every seven years or more, due to financial constraints.
Source: Urbancompany RHP, Redseer Research, HDFC TRU.
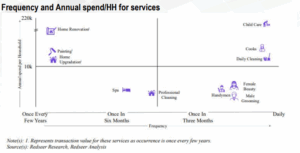
- Services with high annual expenditure but low frequency, such as Home Renovation and Home Painting, are the most expensive, with Home Renovation averaging ₹220k per household annually.
- High-frequency services like Daily Cleaning, Cooks, Female Beauty, and Male Grooming have a lower annual spend, ranging from ₹4k to ₹
- Mid-frequency services, including Handymen and Appliance Repair, have a moderate annual spend, typically between ₹2k and ₹
Market Structure & The Digital Shift
- The home services industry in India is primarily unorganized and fragmented, with a low online penetration. However, the market is undergoing a significant shift as online platforms gain traction.
- The market is catered to by three types of players: unorganized local providers, offline organized players (like salon chains and OEM dealerships), and online full-stack platforms.
- Online full-stack platforms provide a superior value proposition to customers, offering convenience, quality assurance, standardized pricing, and 24/7 booking through user-friendly apps. This has led to a post-COVID shift in consumer behaviour, favouring quicker fulfilment and leading to higher preference and repeat usage.
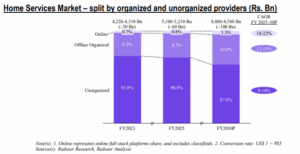
- The online home services market, while small at ₹41-43 billion in FY2025, is projected to grow at a high 18-22% CAGR from FY2025-2030, positioning online players to capture an increasing market share.
Source: Urbancompany RHP, Redseer Research, HDFC TRU.
- The home services market is overwhelmingly unorganized, accounting for 90.5% of the market in FY2025. This share is expected to decline to 87.9% by FY2030. Translating into a CAGR of 9-10%
- Offline Organized players hold an 8.7% share in FY2025, growing to 10.8% by FY2030 translating into a CAGR of 12-15%.
- Online Full-Stack Platforms hold a small but fast-growing share, from 0.8% in FY2025 to 1.3% by FY2030, with a high 18-22% CAGR. This signifies a significant growth opportunity.
Split of Online Market by Cities
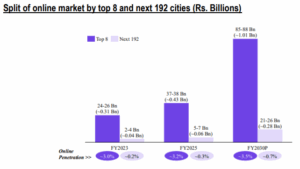
- Relative to the rest of the country, the online home services market is more developed in India’s top 8 cities. This is due to factors like demand density, busier lifestyles, and higher disposable incomes.
- The top 8 cities, which contribute to 85-90% of the online services market in FY2025, have a market penetration of approximately 3.2%. In contrast, the next 192 cities have a much lower penetration of only 0.3% in FY2025.
- In CY2024, approximately 2% of households in India used online home services, compared to over 50% in the United States and approximately 21% in China.
Source: Urbancompany RHP, Redseer Research, HDFC TRU.
- In FY2025, online penetration in the top 8 cities is 3.2%, projected to grow to 3.5% by FY2030 translating into a 1.5% CAGR of for the online players.
- In the next 192 cities, penetration is much lower at 0.3% in FY2025, with a higher projected growth to 0.7% by FY2030. The market in these cities, while smaller, presents a significant growth engine.
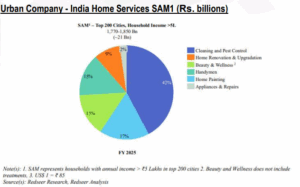
Urban Company’s Serviceable Addressable Market (SAM)
- Urban Company’s Serviceable Addressable Market (SAM) is defined as the home services market it can serve in India’s top 200 cities, encompassing categories it operates in and targeting middle-to-high income households with an income over ₹5 lakhs per annum.
- Urban Company’s SAM in India’s top 200 cities was valued at ₹1,770–1,850 billion (~US$ 21 billion) as of FY2025.
- The SAM is made up of 53 million households in the top 200 cities that use home services (both online and offline).
- Cleaning and pest control services hold the largest share of the SAM, contributing approximately 42%.
- The serviceable market for painting and home decor in the top 200 cities was estimated at ₹470-490 billion (~US$6 billion) for FY2025 and is projected to grow at an annual rate of approximately 13%.
Source: Urbancompany RHP, Redseer Research, HDFC TRU.


 2024 HDFC TRU