
India’s steady surge in SIP contributions has unintentionally supported foreign investors looking to exit domestic equities. This consistent domestic buying has enabled large-scale overseas repatriation, increasing the need for foreign currency. As this demand grows, the rupee has come under additional strain, especially against the euro. What began as routine long-term investing has subtly contributed to a pricier international travel bill.
What? How? That might be your first reaction. Well, allow us to explain.
The reason lies in an unexpected connection between India’s record SIP inflows and the sharp weakening of the rupee against major global currencies, particularly the euro. India’s value-agnostic SIP frenzy has quietly provided the exit liquidity for foreign investors, enabling unprecedented FII selling from Indian equities. As these investors repatriate capital, their demand for dollars and euros has intensified pressure on the rupee – turning your disciplined long-term investing habit into an invisible contributor to a costlier overseas vacation.
Well, lets first review the Rupee depreciation against major currencies. The charts below show the closing value of the INR against the USD and the EUR since July 1, 2024. We have chosen this starting date since the current bout of FII selling started in earnest since October 2024.
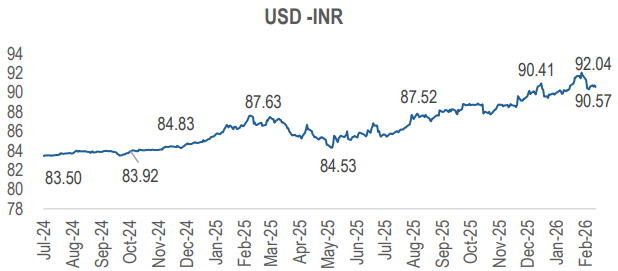
Source: Investing.com
The INR has depreciated by about 8.5% (non-annualised) against the USD during this period. Not bad you would say? But hold on. During this period the USD has depreciated against most other currencies. So lets look at the EUR-INR exchange rates.
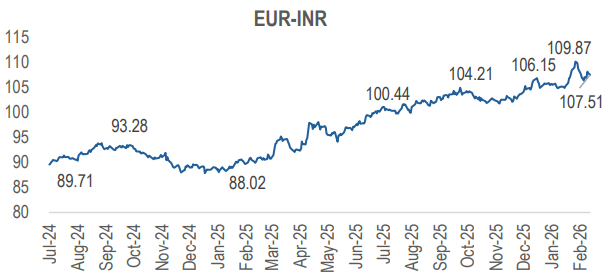
Source: Investing.com
The INR has depreciated by a whopping 20.2% (non-annualised) against the EUR since July 1, 2024. Indeed INR has been one of the worst performing emerging market currencies during this period.
So why has INR performed so poorly. A little theory first. The chart below is an extremely simplified view of the factors impacting the INR.
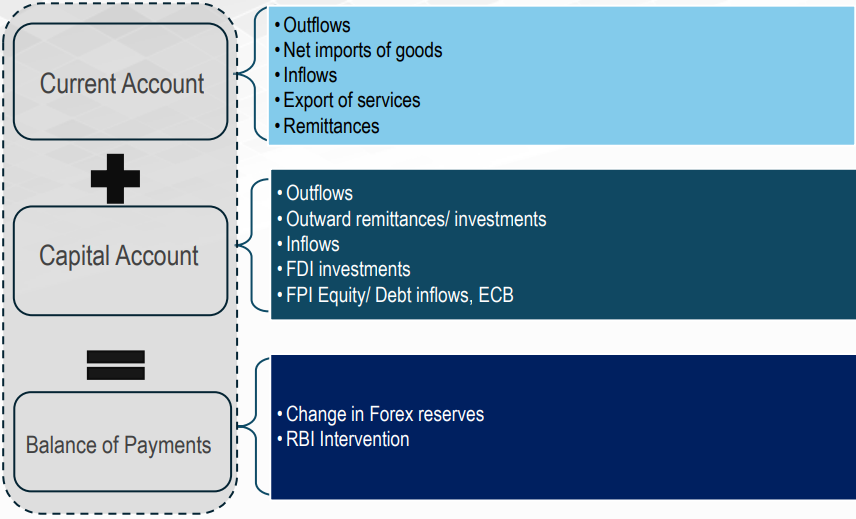
Now, the balance of payments, and hence the INR is impacted by the current account and the capital account. Lets take a historical view of these factors.
We begin with the current account deficit. Historically, India has run a large deficit in trade of goods while maintaining a surplus in trade of services. India’s current account is also supported by substantial inward remittances. Combining the above, India, on aggregate has historically had a current account deficit (CAD, not to be confused with the Canadian currency). The chart is shown below. As can be seen in the chart, India’s current account deficit in the past 12 months has broadly been in line with the historical trends. In fact, during H1FY26, India’s CAD as % of GDP was 0.6% (well below the long-term average of 1.2% of GDP).
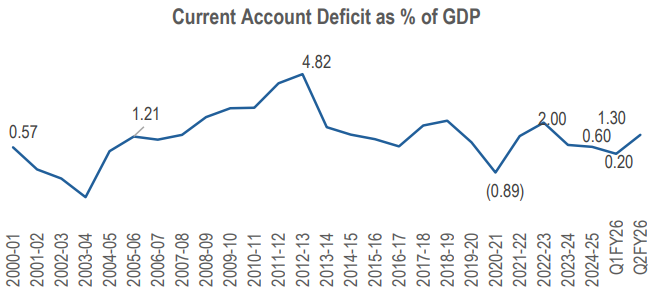
Source: RBI.org, economictimes.com
So, India’s current account deficit has not been a swing factor. Now, lets look at the Foreign Institutional investors’ (FII) net purchases/ sales. Historically, India has received inflows through FII investment, though, it has been more volatile in the past 5 years. The long term chart is shown below.
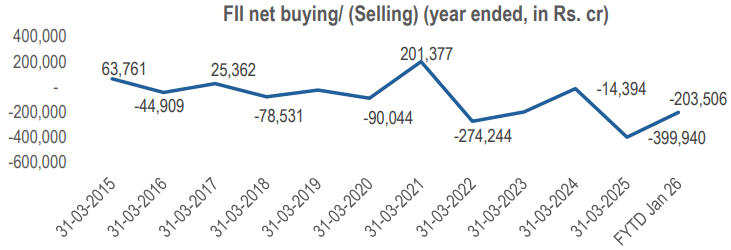
Source: moneycontrol.com
However, FII selling has been unprecedented since Oct 2024. FII’s have sold an aggregate of Rs. 5.25 lac cr from Oct 2024 till Jan 2026 (a period of 16 months). On an annualized basis this amounts to roughly 1.1% of GDP. Compare this with the Current account deficit of 0.6% of GDP in FY25. Clearly FII selling has been a major contributor to the fall in the INR.
You may argue that the selling started in 2022 itself. In Jan 2022, INR was at around Rs. 74.3 per USD and around Rs. 84.3 per EUR. The INR has depreciated by about 22% against the USD and by about 27.9% against the EUR since Jan 2022. Indeed, our argument is strengthened if we were to consider Jan 2022 as the starting point.
So, what has funded this scale of selling. The simple answer is the buying by Domestic Institutional Investors (DIIs). Of course, DII buying has seen a spectacular Rs. 9.7 lac cr since Oct 2024 and about Rs. 17.7 lac cr since Jan 2022. We want to focus on Systematic Investment Plan (SIP) investments though.
The reason for this focus on SIPs is that it has been consistent and growing. The chart below is from Tru Primer on equity supply-demand dynamics published on Dec 19, 2025. SIP investments currently are at around Rs. 31,000 cr per month. Indeed, SIP assets of MFs now aggregate Rs. 16.3 lac cr. (Source AMFI, Economic Times). Over the past 16 months (since Oct 2024), SIP investments have aggregated around Rs. 4.4 lac cr or roughly 45% of total DII buying.
Some have criticised SIP investments on the grounds that it has been value-agnostic and has not worried about the valuations. How is that a criticism?? That is exactly what SIPs are meant to be. It is a tool so that investors maintain disciplined investing and do not agonise over valuations. Indeed, the non-SIP part of the DII inflows may be more at fault as it came in chasing momentum at elevated valuations and expectations of high returns continuing.
Investors must recognize the market equation that every rupee of inflow needs a seller (net of primary issuances). Persistent inflows can push valuations higher for a period. However, once valuations move significantly upward, they also tend to attract selling pressure. Over the past 18 months, FIIs have consistently been on the selling side, adding notable supply to the market. Corporates and promoters, though to a smaller extent, have also contributed through IPOs, OFSs and QIPs.
In this environment, retail investors should be particularly cautious about chasing momentum. Elevated valuations can amplify short-term optimism but often leave little margin for error. Prudent capital allocation – rather than merely following recent price trends – becomes essential to avoiding the risks that come with entering overheated segments of the market.
SIP Flows have been sticky…although the growth is slightly tapered down
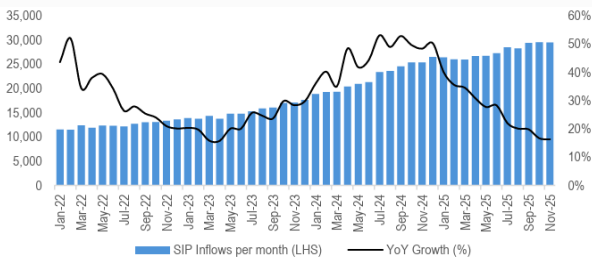
Source: AMFI, HDFC Tru primer dated Dec 19, 2025 (available on LinkedIn and HDFC-Tru.com)
Conclusion:
India has witnessed other bouts of FII selling in the past and indeed INR has weakened during those periods of selling. What is different this time? We would argue two things:
As can be seen from the FII net selling chart, the current bout has been unprecedented, both in scale and pace. This has largely been funded by DII buying (of which SIP is a big component).
In the past, FII selling resulted in a sharp fall in the Indian equity markets. FII investors have been value conscious as shown by the chart below. Any sharp fall used to slow down FII selling and indeed they would turn net sellers again soon enough.
MSCI India 12-month Forward (NTM) P/E vs. Next 6-month Avg. FII Equity Net Flows
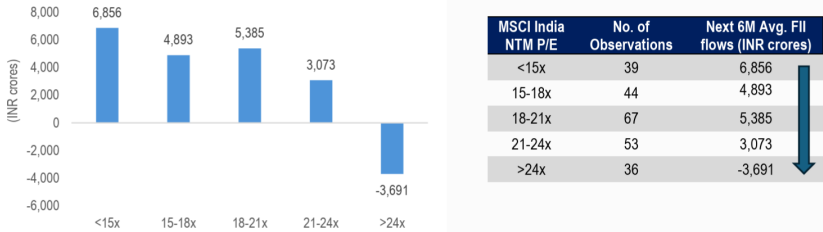
Source: Bloomberg, NSDL, HDFC Tru Primer dated Dec 26, 2025 on FII investment behaviour,
Data Period: Jan, 2006 – Nov, 2025
However, this time, DII buying has cushioned this fall in equity markets. Indeed as we write this, Nifty-50 is barely 3% away from its life time high while the Nifty Midcap Select index is near its life time high. This has allowed even more FII selling. The large scale of FII selling has put pressure on the INR which has hurt FIIs and encouraged even more FII selling creating a negative feedback loop. And this negative feedback loop has worsened the performance of INR.
Historically, RBI has struggled with managing the interplay of inflation, interest rates and exchange rates- the so-called “Impossible Trinity”. SIP inflows and FII selling may just have complicated matters even more.


 2024 HDFC TRU