
The Indian stock market saw a strange situation this year where strong local interest was cancelled out by a massive amount of new shares entering the market. While local investors and mutual funds have stepped up to buy shares, their buying power is being used up by record-breaking company listings (IPOs) and heavy selling by foreign investors. Looking ahead, the Indian equity market is poised for a period of range-bound consolidation. This is driven by a massive primary market (IPO) pipeline exceeding ₹2.5 lakh crores, which is expected to absorb significant liquidity from the secondary market.
Despite the IPO frenzy, the Nifty IPO Index has lagged the Nifty 500 by ~15% YTD. While the current surge in IPOs has yielded significant windfalls for company founders, it has largely resulted in underperformance for the general public. With >100 mainboard IPOs hitting the market this year, the frenzy is undeniable. Infact, the median return from subscribing to all IPOs this year was close to 0%, with ~50% of the listings in the last 12 months are now trading below their offer price.
Figure 1: Nifty IPO vs. Nifty 500 Relative Performance (re-based to 100)
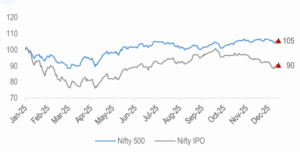
Source: Bloomberg, HDFC TRU. Priced as of 16 Dec-25.
Figure 2: Median Returns of IPOs (Mainboard +SME) by listing month (%)
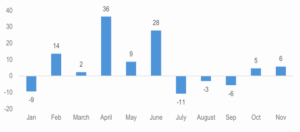
Source: Capitalmind Mutual Fund, Media Reports, HDFC TRU.
Aggregate primary market equity issuances during the year (Jan-Nov’25):
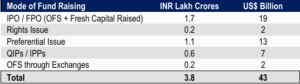
Figure 3: Consolidated Resource Mobilisation through Primary Markets (INR ‘000 crores)
Source: SEBI, NSE, Prime Database, HDFC TRU.
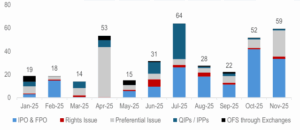
Figure 4: Number of Mainboard IPOs and DRHPs Filed
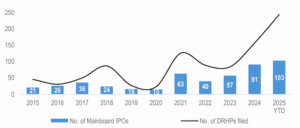
Source: Media Reports, Prime Database, HDFC TRU.
Figure 5: Promoter and PE/VC selling through bulk/block deals in NSE-500 stocks (US$ bn)
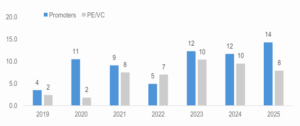
Source: Prime Database, Kotak Institutional Equities, HDFC TRU.
Figure 6: FPI ownership now below the long-term average
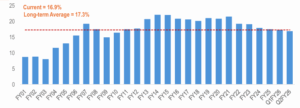
Source: NSE, HDFC TRU.
Domestic Flows: The Only “Stabilizer”
Domestic institutional investors, such as mutual funds, insurers, pension funds, have emerged as the sole net buyers of Indian equities this year. SIP inflows, insurance allocations, and household participation have provided a structural demand base that has prevented sharp corrections.
Figure 7: SIP flows have been sticky…although the growth is slightly tapering down
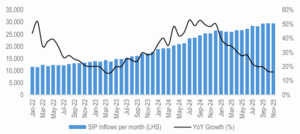
Source: AMFI, HDFC TRU.
Figure 8: DII net flows in 2025 has outpaced the combined flows of the entire decade (i.e., 2013-2022)
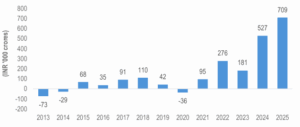
Source: NSE, BSE, HDFC TRU. Note: 2025 data is as of 30 November, 2025.
We are reminded once again why Warren Buffett called Market Cap-to-GDP ratio as the best indicator of stock valuation. While the P/Es of the listed markets have more or less remained the same, the massive supply of papers over the last few years has meant far many newer companies soaking up the capital and thus inflating the Market Cap-to-GDP ratio from 88% in 2020 to 132% now.
Figure 9: India’s Market Cap to GDP Ratio (%)
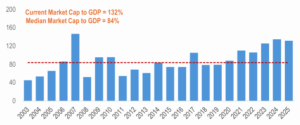
Source: Bloomberg, HDFC TRU. Priced as of 17 Dec-25.
Note: CY25 is based on total NSE market cap of $5.1 trn and Annualized GDP of $4 trn.
Going forward, we believe the biggest threat to Indian equity markets is the exhaustion of the Indian retail investor. For years, the “SIP culture” has acted as an unbreakable floor for the Nifty, absorbing every foreign / promoter sell-off with relentless domestic liquidity. But this wall of money is the market’s single point of failure, in our view.
Our analysis confirms that flows are not random but are systematically pro-cyclical, they surge after strong returns have been made and tend to evaporate when opportunities are the most attractive, i.e., markets are in a correction / consolidation phase.
Figure 10: Inflows tend to be strong during periods of high returns, while redemptions spike during periods of weakness
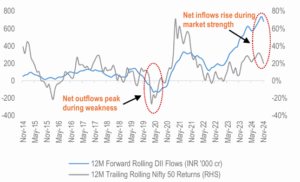
Source: ACE MF, Investing.com, HDFC TRU.


 2024 HDFC TRU