The introduction of the Goods and Services Tax (GST) in India on July 1, 2017, marked a monumental shift in the nation’s indirect taxation landscape. GST aimed to create a unified national market, streamline tax compliance, and enhance transparency. Beyond its primary fiscal objectives, the highly digitized nature of GST has inadvertently made it a rich source of real-time economic data.
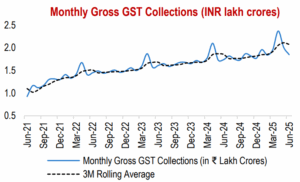
Source: PIB, GST Portal.
The growth trajectory of GST collections is increasingly recognized as a vital barometer for assessing India’s aggregate economic performance, specifically its GDP and GVA growth. India is largely a consumption-driven economy. As GST is fundamentally a consumption tax (borne by the end consumer), its collections directly mirror the level of consumption expenditure and, by extension, overall economic activity. A robust growth in GST collections signifies healthy consumer demand and business transactions across various sectors.
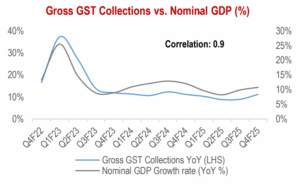
Source: CEIC, Income Tax Department (link).
The sustained growth in GST collections over recent years, often exceeding nominal GDP growth, underscores its dual contribution from economic expansion and enhanced tax compliance. This makes it a powerful, albeit not exclusive, tool for assessing the dynamism of the Indian economy.
Moreover, according to a study published by the GST Department, Government of Kerala (here), the states with higher GST collections tend to show stronger GDP growth, though the relationship tends to vary due to factors like sectoral composition, tax efficiency, and policy implementation.
| State | Average GST Revenue (₹ Cr.) | Average Nominal GDP Growth (%) | GST-GDP Correlation (r) |
|---|---|---|---|
| Maharashtra | 1,80,000 | 7.5 | 0.82 |
| Tamil Nadu | 1,20,000 | 6.8 | 0.78 |
| Karnataka | 1,10,000 | 7.2 | 0.79 |
| Gujarat | 1,00,000 | 7.0 | 0.75 |
| Uttar Pradesh | 90,000 | 6.5 | 0.70 |
| Bihar | 30,000 | 5.2 | 0.55 |
| Jharkhand | 28,000 | 5.0 | 0.50 |
| West Bengal | 70,000 | 6.0 | 0.65 |
| Punjab | 40,000 | 5.8 | 0.60 |
| Chhattisgarh | 35,000 | 5.5 | 0.58 |
Source: GST Department, Government of Kerala (link).
The growth in GST collections acts as a robust indicator for overall GDP growth, reflecting underlying consumption patterns and the formalization of the economy. Closely monitoring these GST data points can provide a significant analytical edge:


Investment Charter

 2024 HDFC TRU