
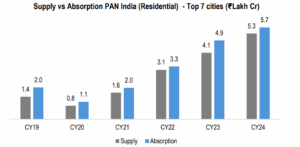
The Indian real estate industry has experienced a broad-based recovery across all segments since the pandemic, but the residential market has arguably seen the swiftest and steepest resurgence among all real estate segments. Sales volumes in the primary market grew at an annualized rate of 29% since 2020 and culminated a multi-year high in 2024. Market sentiment has been very positive largely due to an upbeat economic outlook with real GDP growth rate for India amongst the highest levels in the world.
Source: Kalpataru Ltd DRHP.
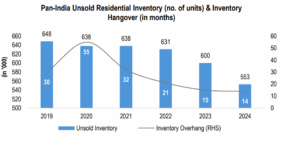
Due to strong supply and absorption in the Indian residential real estate market, the unsold inventory across the top-7 cities has decreased. Unsold units fell from 6,38,015 in 2020 to 553,073 units in 2024. This has resulted in the inventory overhang dropping to 14 months in 2024, which is the lowest level in the last 6-7 years.
Source: Kalpataru Ltd DRHP.
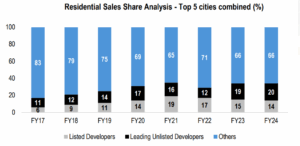
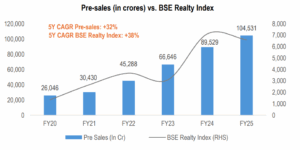
Leading developers in top 5 cities have shown an increase in share from 17% in FY17 to 34% in FY24, thus highlighting that the branded developers are increasing the share in the market. Concurrently, pre-sales value of companies witnessed substantial growth, soaring from ₹26,046 cr in FY20 to ₹1,04,531 cr in FY25 showing a 32% CAGR. It is mainly increase in number of projects launched by companies due to high demand in market.
Source: Kalpataru Ltd DRHP.
| Presales value (In Cr) | FY20 | FY21 | FY22 | FY23 | FY24 | FY25 | 5Y CAGR |
| DLF | 2,485 | 3,084 | 7,273 | 15,058 | 14,778 | 21,223 | 54% |
| Macrotech | 6,570 | 5,968 | 9,024 | 12,060 | 14,520 | 17,630 | 22% |
| Prestige Estate | 4,561 | 5,461 | 10,382 | 12,931 | 21,040 | 17,023 | 30% |
| Godrej Properties | 5,915 | 6,725 | 7,861 | 12,232 | 22,527 | 29,444 | 38% |
| Oberoi Realty | 1,257 | 3,279 | 3,885 | 5,100 | 3,944 | 5,259 | 33% |
| Brigade Enterprise | 2,377 | 2,767 | 3,023 | 4,108 | 6,013 | 7,696 | 27% |
| Sobha Developers | 2,881 | 3,137 | 3,871 | 5,189 | 6,643 | 6,277 | 17% |
| Total | 26,863 | 31,116 | 46,346 | 68,499 | 91,794 | 107,507 | 32% |
Source: Company Reports.
The BSE Realty Index recorded a strong CAGR of 38% between FY20 and FY25. In the same period, the aggregate pre-sales value of key real estate companies demonstrated substantial growth, increasing from ₹26,046 cr in FY20 to ₹1,04,531 cr in FY25, reflecting a 5Y CAGR of 32%.
Source: Company presentation, Investing.com


Investment Charter

 2024 HDFC TRU