Stop focusing on short-term wins! This analysis, spanning mutual fund data from 2005 to 2025, shows that a fund’s recent stellar performance especially its 1-year return is often a misleading boost that inflates its overall record and doesn’t reliably predict future success. The main lesson is to resist the urge to “chase” the current top-ranked funds; true investing strength comes from consistency over the long haul, not from a single, spectacular sprint.
Imagine you’re an investor, and an equity asset manager approaches you, showcasing a set of brilliant returns. They’re in the middle of a “purple patch”, a period of excellent, recent outperformance—and they’re eager to show off. They present periodic returns (1-year, 3-year, 5-year) stacked against the market benchmark and their competitors.
You look at the numbers, and they all look impressive. This happens because the manager’s incredible recent outperformance (the 1-yr return) simply folds into and inflates the 2-yr, 3-yr, and 5-yr performance as well.
Also, often the time proven schemes go through temporary rough patch. In such situations, the fund manager could be under pressure to change selection thesis.
In this study, we evaluate the efficacy of looking at only the recent outperformance.
As indicated above, the funds who hit a purple patch (recent outperformance – 1 year return in this case) approach investors and showcase them periodic returns as against the benchmark / peer group.
Illustration listed below demonstrates that recent outperformance (1 year in this case) folds into 2 yr, 3 yr, 4 yr, 5yr returns as well.
If one looks at point to point returns as of Aug-25, it shows as:
| 1 Yr | 2 Yr | 3 Yr | 4 Yr | 5 Yr | |
|---|---|---|---|---|---|
| Fund 1 | 15.0% | 15.0% | 15.0% | 15.0% | 15.0% |
| Fund 2 | 45.0% | 19.8% | 17.1% | 16.4% | 15.1% |
Fund 2 looks better than Fund 1 across time horizons.
Now, Consider the performance of the following 2 funds in each of the last 5 years
| 2025 | 2024 | 2023 | 2022 | 2021 | |
|---|---|---|---|---|---|
| Fund 1 | 15.0% | 15.0% | 15.0% | 15.0% | 15.0% |
| Fund 2 | 45.0% | -10% | 12.0% | 14.0% | 10.0% |
As we deep dive, we can see that Fund 1 has been a consistent fund across the 5 calendar years. Whereas, Fund 2 has done exceptionally well in 2025 (could be that a couple of stocks gave exceptional returns in 2025).
Though, Fund 2 looks better than Fund 1 across time horizons. However, we know that fund 1 has been more consistent.
➢ Should we only look at recent outperformers amongst a peer group?
➢ Should we sulk unduly if our trusted manager lagged peers in the last 1 year?
In an attempt to answer these questions, we did the following analysis on mutual fund schemes. We have picked MFs because of the depth of available data. The thesis should be equally true for all other asset managers.
We got the following CAGR returns at the end of the testing period (2005-2025):
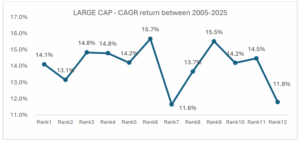
In the chart x axis – Rank 1 means investing every year into #1 ranked funds, Rank 2 means investing into #2 ranked fund ….and so on. Rank 12 means investing every year into #12 ranked fund
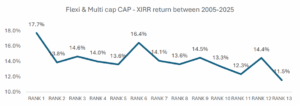
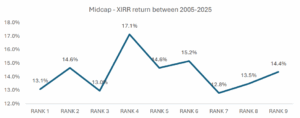
We extended the same analysis to Multi/Flexi-cap mutual funds (30 funds) and Midcap mutual funds (29 funds) for the period from 2005 to 2025. The CAGR return, at the end of the period are shown below:
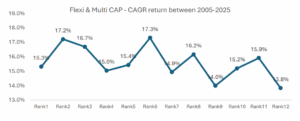
In the chart x axis – Rank 1 means investing every year into #1 ranked funds, Rank 2 means investing into #2 ranked fund ….and so on. Rank 12 means investing every year into #12 ranked fund
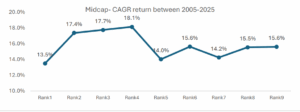
In the chart x axis – Rank 1 means investing every year into #1 ranked funds, Rank 2 means investing into #2 ranked fund ….and so on. Rank 12 means investing every year into #12 ranked fund
As can be seen in the chart above, a similar trend of random dispersion is evident in Flexi/Multi Cap and Midcap strategies.
We got the following XIRR returns at the end of the testing period (2005-2025):
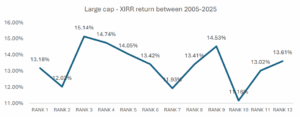
In the chart x axis – Rank 1 means investing every year into #1 ranked funds, Rank 2 means investing into #2 ranked fund ….and so on. Rank 8 means investing every year into #8 ranked fund
We extended the same methodology to Multi/Flexi-cap mutual funds (30 funds) and Midcap mutual funds (29 funds) over the period from 2005 to 2025. Key observations are highlighted in the chart below: –
In the chart x axis – Rank 1 means investing every year into #1 ranked funds, Rank 2 means investing into #2 ranked fund ….and so on. Rank 8 means investing every year into #8 ranked fund
In the chart x axis – Rank 1 means investing every year into #1 ranked funds, Rank 2 means investing into #2 ranked fund ….and so on. Rank 8 means investing every year into #8 ranked fund
We’re seeing similar results in Midcap and Flexi/Multi Cap strategies, where return dispersion is quite evident.
A unique trend in the Flexi/Multi Cap category shows that while the Rank 1 fund has delivered the best performance, there’s a lack of consistency among the other ranked funds. Notably, the Rank 6 fund emerges as the second-best performer, clearly highlighting the disparity in returns across the ranking spectrum.


Investment Charter

 2024 HDFC TRU