
Global equity benchmarks have become unusually dependent on a single theme: “AI”. The Mag-7 is currently ~35% of the S&P 500, TSMC is ~58% of MSCI Taiwan, and Samsung Electronics plus SK Hynix make up more than 50% of MSCI Korea, with the same names dominating MSCI EM and MSCI Asia (ex-Japan) indices. Earnings momentum is even narrower than market caps suggest, with just 10 stocks reportedly accounting for ~60% of recent S&P 500 EPS revisions. This signals that a single-theme drawdown, whether from an AI capex reset, a DeepSeek-style efficiency shock, or geopolitical disruption to Taiwan / South Korea, would transmit simultaneously across global equity markets.
Executive Summary
Global equity benchmarks have rarely been this dependent on a single theme. The IT sector in the US now makes up >40% of the S&P 500. TSMC alone accounts for around 58% of MSCI Taiwan Index and 44% of TAIEX. Samsung Electronics and SK Hynix together represent >50% of MSCI Korea Index. At the same time, almost all of the recent positive earnings momentum at the index level, across both developed and emerging markets, is being driven by AI infrastructure beneficiaries, e.g., semiconductors, hyperscalers, memory, and selected enablers.
Concentration is not new, but it has two implications for portfolios – (i) it is partly a justification for current valuations, and (ii) it is also the mechanism by which a single-theme drawdown could transmit broadly.
Figure – 1: Such has been the outperformance of the info tech sector in the US that the S&P 500 IT / Semiconductor Index have delivered 24% / 36% CAGR returns over the last 10 years vs. the S&P 500 (ex-IT) Index at just 10%…
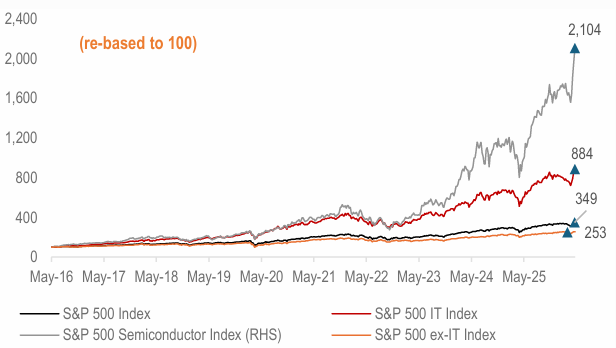
Source: Bloomberg, HDFC TRU.
Figure – 2: …The IT & Communication Services sector now accounts for ~43% of S&P500, the highest concentration in modern S&P history….
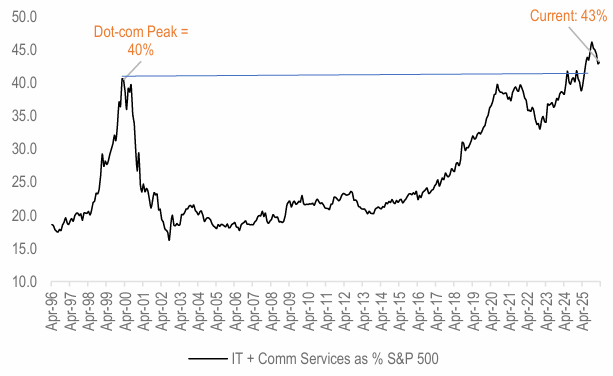
Source: Bloomberg, HDFC TRU.
Figure – 3: Even in Emerging markets, we see a similar story, with the tech sector outperforming the broader index materially (10Y CAGR of ~23% for the MSCI EM Info Tech Sector vs. a paltry ~7% growth for the MSCI EM Index)…
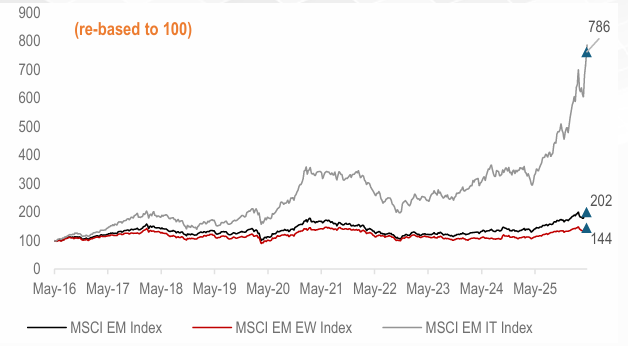
Source: Bloomberg, HDFC TRU.
Major Global Equity Indices have become AI / Semiconductor Sector Proxies…
1) S&P 500. The Mag-7 (Apple, Microsoft, Nvidia, Amazon, Meta, Alphabet, Tesla) today makes up roughly 35% of S&P 500 market cap, up from ~18.5% as of early 2020.
Figure – 4: Magnificent -7 stocks now account for more than 1/3rd of the S&P 500 Index…
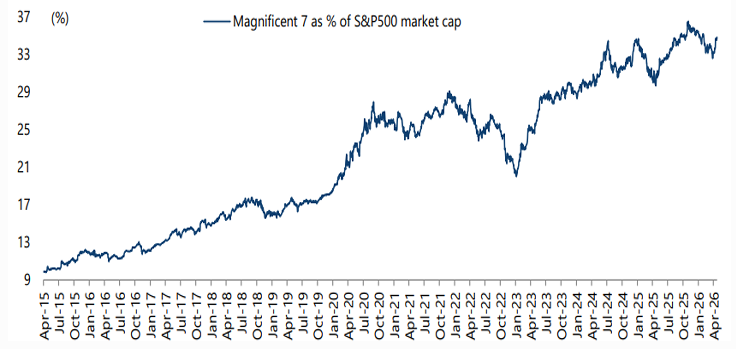
Source: Bloomberg, Greed & Fear Report, HDFC TRU.
2) MSCI Emerging Markets. Concentration is more acute, not less. TSMC alone accounts for around 13% of the index. The top-10 holdings represent ~32% of the benchmark, and five of those are from a single sector — TSMC, Samsung Electronics, SK Hynix, Delta Electronics and Hon Hai. A passive EM allocation today is, in large part, an Asian semiconductor allocation.
3) Single-country indices in Asia. The picture sharpens further at the country level:
Figure – 5: Three Semiconductor stocks (i.e., TSMC, SK Hynix and Samsung Electronics) comprise almost ~24% of the MSCI EM Index today…
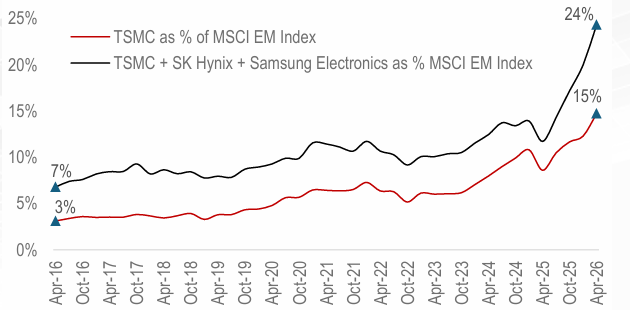
Source: Bloomberg, HDFC TRU.
What is driving the AI / Semiconductor rally?
1) Hyperscaler capex at unprecedented scale. The five largest US hyperscalers (Microsoft, Alphabet, Amazon, Meta and Oracle) are on track to spend a combined $700 bn on AI infrastructure in 2026, up from roughly $380 bn in 2025. This spending flows directly into the revenue lines of the chipmakers, memory producers, networking equipment vendors, and power suppliers that dominate today’s index leadership.
Figure – 6: US real AI-related capex, rose by ~20% YoY in 4QCY25, while non-AI capex was down by ~3% YoY…
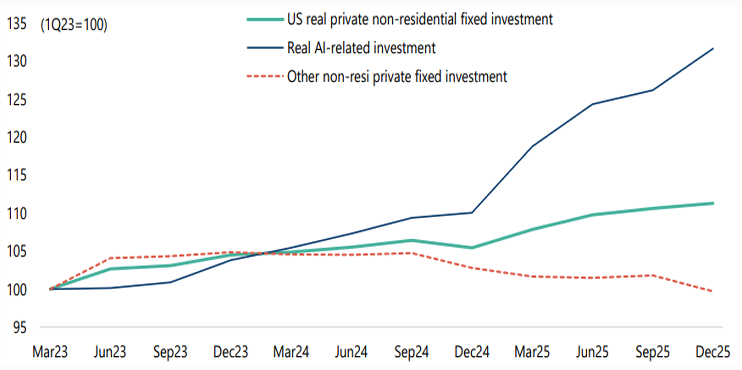
Note: AI-related capex includes real private fixed investment in information processing equipment, software and data center construction.
Source: Bureau of Economic Analysis, Greed & Fear Report, HDFC TRU.
2) A genuine memory and logic supercycle. Demand for high-bandwidth memory (HBM) and leading-edge logic has outstripped supply, with TSMC publicly stating it expects AI demand to exceed capacity through 2027. SK Hynix, the dominant HBM supplier to Nvidia, has seen quarterly profits jump multi-fold. Micron’s 2026 EPS estimates have been revised up by triple-digit percentages.
Figure – 7: Logic and Memory Shipments Drive Market Growth
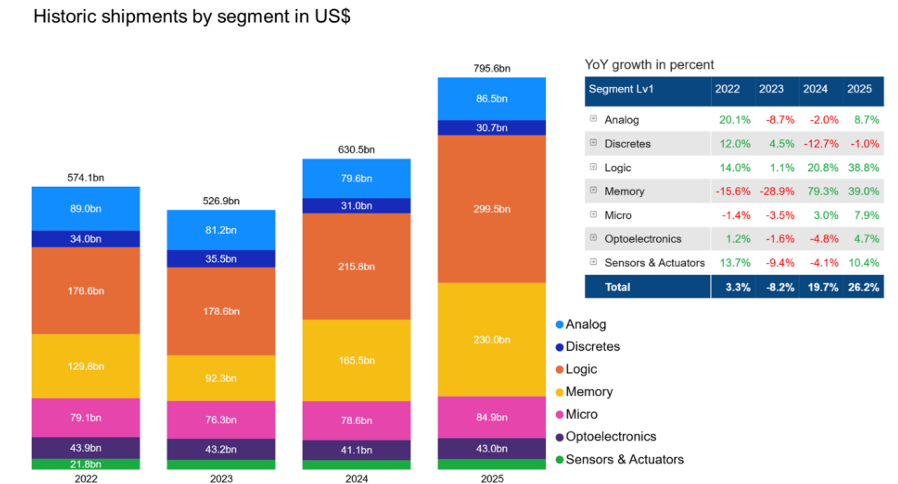
Source: World Semiconductor Trade Statistics, HDFC TRU.
Figure – 8: MSCI EM Asia Semiconductor & Semiconductor Equipment Index quarterly performance; both ROEs and Operating margins have almost doubled over the last 2 years (Mar-24 vs. Mar-26)…
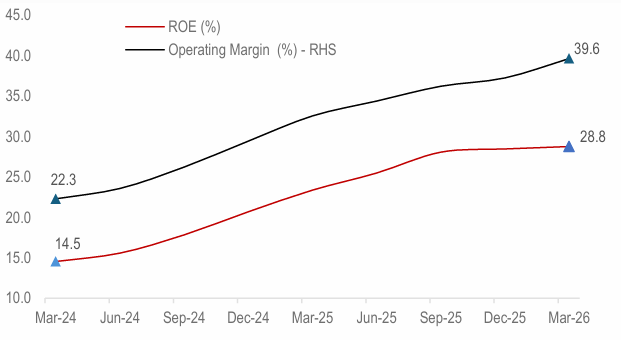
Source: World Semiconductor Trade Statistics, HDFC TRU.
The Earnings Picture: AI is doing most of the work
Concentration is uncomfortable when valuations diverge from earnings. The pushback to the bear case has been straightforward: earnings have been keeping up. The data largely supports this but in a very narrow way.
Table – 1: S&P 500 Upward Revisions heavily driven by Tech & Semiconductor Companies
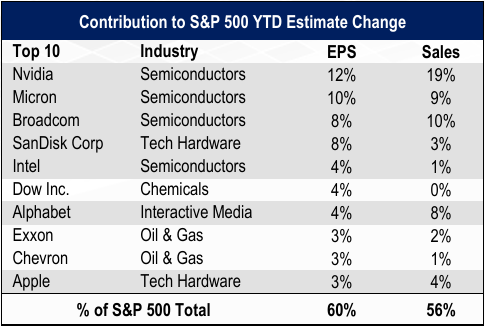
Source: Alpine Macro, Bloomberg.
Figure – 9: APAC Semiconductor Shipments Growth at Multi-year Highs…
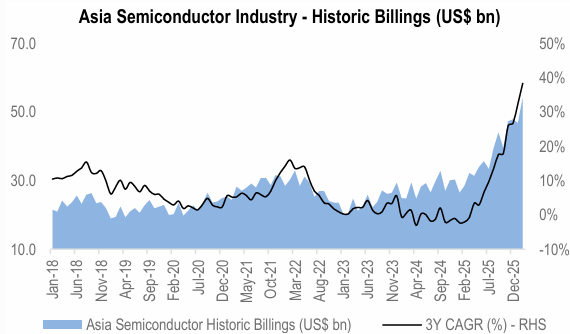
Source: World Semiconductor Trade Statistics, HDFC TRU.
Figure – 10: MSCI AC Asia ex-Japan 2026 forecast earnings revisions by sector (1M EPS Revisions %)
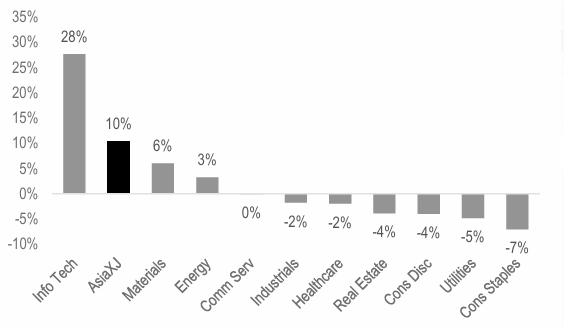
Source: Bloomberg, HDFC TRU.
Why This Matters?
Figure – 11: US major hyperscalers’ capex as % of revenue and operating cashflow (OCF) at multi-year highs…
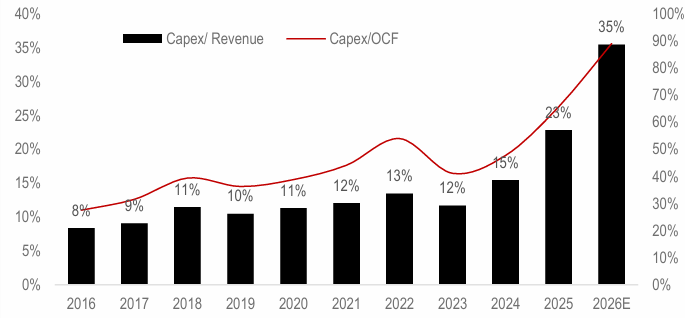
Note: Microsoft, Amazon, Alphabet, Oracle and Meta. 2026 based on consensus estimates.
Source: Bloomberg, HDFC TRU.
Figure – 12: Maximum Drawdown Analysis; Cap-weighted indices outperform on the way up and underperform on the way down when leadership is this narrow…
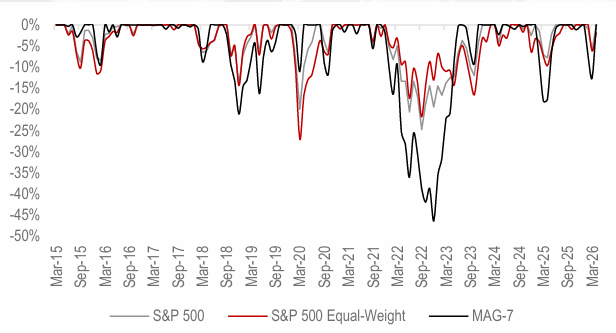
Source: Bloomberg, HDFC TRU.
Our View
Figure – 13: A slow rotation has started from the “New Economy” towards “Old Economy”….
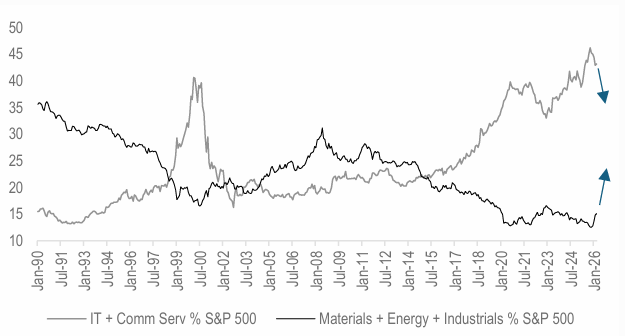
Source: Bloomberg, HDFC TRU.
Figure – 14: Nvidia Tops India’s Stock Market in Market Value (in US$ trn)
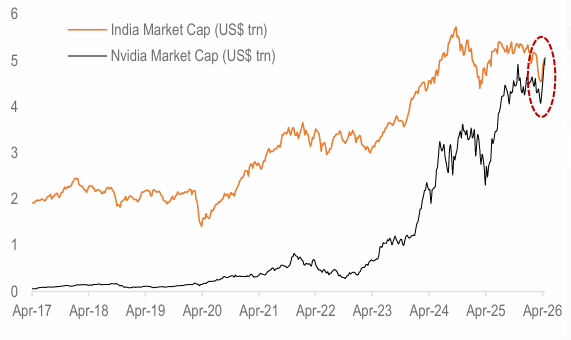
Source: Bloomberg, HDFC TRU.
Figure – 15: The Global Semiconductor Index (SMH ETF) looks extremely overbought and is trading at >40% above its 200-DMA…
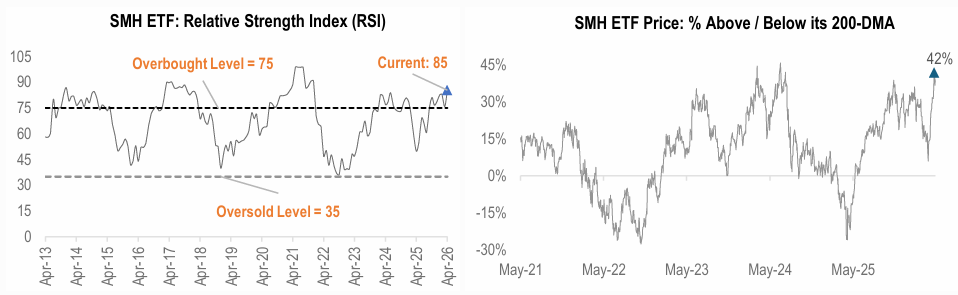
Source: Bloomberg, HDFC TRU.
Figure – 16: Indian Equities (MSCI India) have underperformed the Emerging Markets (EM) and Asia (ex-Japan) Index by ~30% on a 2-year rolling basis…which is at an all-time low….
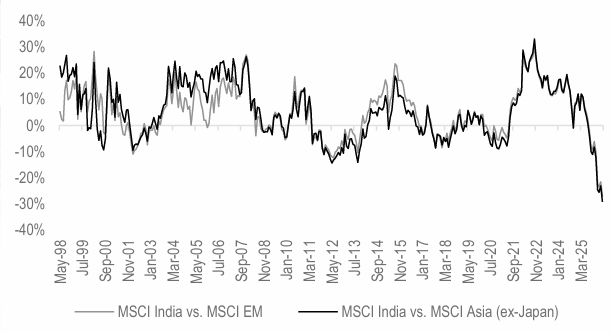
Source: Bloomberg, HDFC TRU.
Figure – 17: Indian equities looks extremely oversold in Gold (ounces)…which implies that Indian Equities are at very attractive levels and should outperform Gold over the medium-term….
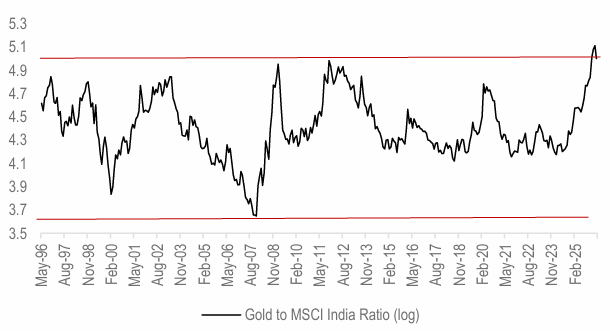
Source: Bloomberg, HDFC TRU.
Figure – 18: MSCI India is currently trading ~4% below its 10-year median on a 12-month forward P/E basis…
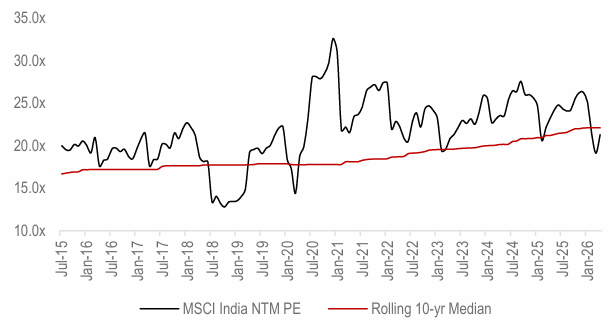
Source: Bloomberg, HDFC TRU.


 2024 HDFC TRU