After a strong rally in 2025, Precious metals are currently trading in a stretched zone and appear to have entered a phase where price momentum is increasingly driven by financial flows (ETFs). History suggests that such phases often lead to heightened volatility and meaningful drawdowns. While the strategic long-term case for Precious metals (especially Gold) remains intact, the current market conditions suggests a cautious approach, favouring patience until prices and positions reset.
Precious Metals: The Best-Performing Asset Class of 2025
The entire precious metals complex (Gold, Silver, Platinum and Palladium) staged a sharp and near-vertical rally over the past year, driven by a potent mix of central-bank buying, geopolitical anxiety, US dollar weakness, and investor FOMO.
Figure 1: Asset Class Performance CY2025 YTD (%, US$)
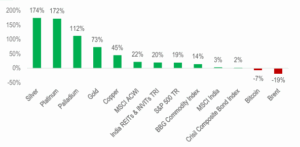
Source: Bloomberg, Investing.com, HDFC TRU. Note: Priced as of 26th December 2025.
…In fact, 2025 stands out as a historic milestone for Precious Metals, delivering their best-ever calendar-year performance since 1980; however, history serves as a reminder that greatest years of outperformance in precious metals are typically followed by extended lulls…
- Gold is currently witnessing a ‘once-in-a-generation’ rally. With returns reaching ~75% in CY2025, the metal has not only eclipsed but has also doubled its best-ever annual performance of 31% in 2007. This emphasizes just how significantly Gold has repriced in the current market.
- Silver has been the undisputed star of CY2025, with returns exceeding 150%, effectively more than doubling Gold’s performance. However, Silver’s profile remains inherently more volatile; historically, such vertical rallies, like those seen in 1979 and 2011, are followed by multi-year periods of consolidation.
Figure 2: Gold – Calendar Year Returns (%, US$)
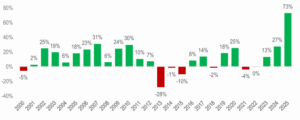
Source: Bloomberg, HDFC TRU. Note: Priced as of 26th December 2025.
Figure 3: Silver – Calendar Year Returns (%, US$)
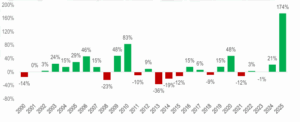
Source: Bloomberg, HDFC TRU. Note: Priced as of 26th December 2025.
Setting the Case for Caution in Gold and Silver:
Precious Metals historically served as portfolio insurance, i.e., stores of value during periods of inflation, currency debasement, and systemic stress. Over the last cycle, however, the narrative has shifted from insurance to performance chasing. Prices have surged well ahead of trend, supported by aggressive ETF inflows, speculative positioning, and a belief that central-bank buying represents a one-way structural bid.
1. Gold Prices have run ahead of its Anchors:
- Valuing Gold is tricky because they don’t work like a business or a rental property. When you value a company, you look at how much cash it earns (dividends or profits) and use that to set a price. Since a bar of gold just sits there and doesn’t “grow”, the best way is to look at its value relative to the money around it.
- To do this, we compare Gold to two most important things: the amount of money in the system (M2) and the cost of living (CPI). Gold prices, when adjusted for both US inflation (CPI) and US Money Supply (M2), are now trading at their highest real premium since the mid-1980s.
- Historically, such valuation extremes have tended to precede periods of consolidation, higher volatility, or subdued forward returns rather than sustained upside.
Figure 4: Gold Prices Adjusted for US Money Supply…at its highest level in over 40 years
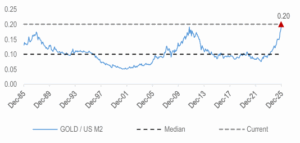
Source: Bloomberg, FRED, HDFC TRU. Note: Priced as of 26th December 2025.
Figure 5: Gold Prices Adjusted for US Consumer Price Index…at all-time highs
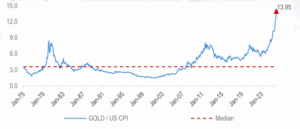
Source: Bloomberg, FRED, HDFC TRU. Note: Priced as of 26th December 2025.
2. The Rate of Incremental Central Bank Buying Appears to Be Slowing:
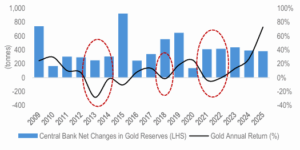
- Central banks buying, particularly from emerging markets, have been the backbone of the recent rally in Gold. However, while absolute demand remains strong, the rate of incremental buying appears to be slowing.
- While Gold holdings remain elevated, the pace of incremental buying has slowed. Some countries (e.g. Singapore, Uzbekistan) have begun to rebalance their reserves, monetize gains, or pause accumulation after front-loading purchases.
Figure 6: Despite Central Banks being net buyers of Gold every single year since 2008, history shows that periods of aggressive price appreciation have been followed by meaningful corrections…
Source: Bloomberg, World Gold Council, HDFC TRU. Note: Priced as of 26th December 2025.
Figure 7: Reported Changes In Central Bank Reserve Holdings (in Tonnes)
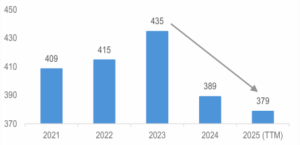
Source: World Gold Council, HDFC TRU. Note: 2025 data was only available till Oct-25, therefore, we have used a TTM number to make it like-for-like vs. prior years.
3. The Current Gold-Silver Ratio indicates muted returns especially for Silver in the near to medium-term…
- The Gold–Silver ratio has retraced to 57, positioning it just under the long-term median of 63. Historically, lower ratios have coincided with late-cycle / risk-off phases, where forward returns, especially for Silver, tends to be muted.
- In this context, the current Gold–Silver ratio suggests asymmetric risk for Silver, with limited upside from current levels with a higher probability of consolidation or drawdowns if macro/demand tailwinds soften.
Figure 8: Gold-Silver Ratio (Monthly) trending below 60 levels (vs. long-term median of 63)…lowest level since 2013
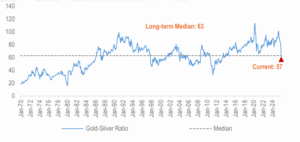
Source: Bloomberg, HDFC TRU. Note: Priced as of 26 December 2025.
Figure 9: Gold-Silver Ratio (Monthly) vs. Silver forward returns
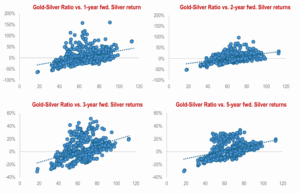
Source: Bloomberg, HDFC TRU. Priced as of 26 December 2025. Note: We have used Monthly data for the above charts since 1980.
Figure 10: Our analysis highlights muted median returns for Silver across periods, whenever the Gold-Silver ratio is less than or equals to 60…
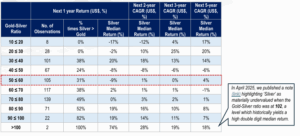
Source: Bloomberg, HDFC TRU. Data Period: Jan-1970 to Dec-2025.
Note: The above calculations are based on monthly Gold-Silver Ratio data.
4. China’s Growth Slowdown: A Headwind for Metals
- China remains the single largest marginal consumer of global metals, particularly for industrial commodities and Silver, where fabrication demand is closely tied to construction, electronics, and manufacturing activity.
- The ongoing weakness in China’s economy, marked by a prolonged property-sector downturn, subdued credit growth, and fragile consumer confidence, poses a structural headwind to physical metals demand. · Moreover, an IMF paper (here) highlighted that a 1% slowdown in China’s industrial growth can lead to about 5–7% decline in metal prices over the following year, underscoring China’s outsized influence on metals demand. In a slowing China scenario, this sensitivity poses downside risk for metals, particularly Silver with its industrial exposure.
Figure 11: China’s Real GDP Growth (%) continues to be in a downtrend… with IMF estimating 4.5% for 2026E
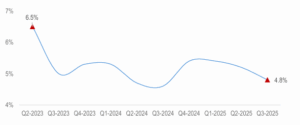
Source: Trading Economics, HDFC TRU.
Figure 12: Chinese Investment in Real Estate Development (y/y change %)…almost at COVID-19 lows
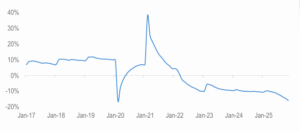
Source: Bloomberg, Silver Institute, HDFC TRU.
Figure 13: China’s economic momentum cooled materially as factory output hit a 15-month low and retail sales slumped to levels not seen since the lifting of “zero-COVID” restrictions…

Source: Trading Economics, HDFC TRU. Note: China reports combined Jan-Feb data for industrial production and retail sales.
5. Growing dominance of financial demand (Gold / Silver ETFs), materially increases downside risk by amplifying flow-driven volatility
- In 2025, the precious metals market saw a historic structural shift as financial demand increasingly decoupled from traditional physical consumption. While record-high prices have naturally cooled the appetite for jewelry and retail bullion, institutional and digital inflows have reached unprecedented heights.
- Especially in Silver, we note that the surge in ETF holdings relative to reported exchange inventories highlights the growing dominance of financial demand over physical consumption.
- ETF flows have played a disproportionate role in tightening the market balance over the past two years. In 2025 alone, net investment into ETFs amounted to ~200 million ounces (oz), materially exacerbating an already tight physical market. Excluding ETFs, the underlying market deficit stood at ~95 million ounces (oz); however, once ETF flows are included, the effective deficit widened sharply to ~295 million ounces (oz). Any reversal or even moderation in ETF inflows therefore poses a meaningful risk of downside volatility, as the market would need to rapidly re-absorb this incremental supply.
- When price discovery is driven more by flows and positioning than end-use fundamentals, price action tends to become more reflexive / volatile. This raises the risk that any reversal in sentiment could lead to disproportionately sharp drawdowns.
Figure 14: Global Silver ETF Holdings (in millions oz) have increased at a CAGR of ~9% over the last 2 years…
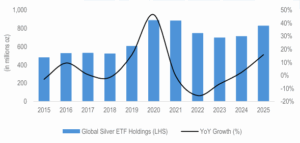
Source: Bloomberg, HDFC TRU. Note: 2025 Data is as of Nov-25.
Figure 15: …While Global Gold ETF Holdings (in millions oz) increased at a CAGR of >10% over the last 2 years
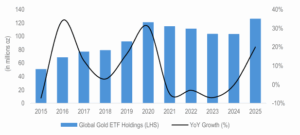
Source: World Gold Council, HDFC TRU. Note: 2025 Data is as of Nov-25.
6. Silver’s Physical Supply-Demand Market Deficit Narrowing
- Photovoltaics (PV) were the key demand drivers for Silver over the last decade or so (~16% of the total 2025E Demand). While we note that the growth remains intact, rapid innovation in solar cell technology is structurally reducing Silver intensity.
- Newer cell architectures such as PERC (Passivated Emitter and Rear Cell), TOPCon (Tunnel Oxide Passivated Contact) and HJT (Heterojunction Technology) are designed to improve efficiency while lowering material costs.
- Under sustained cost pressure, manufacturers are steadily reducing Silver paste usage per watt and increasingly substituting Silver with Copper-based metallization where feasible. As a result, Silver loading per watt has been on a clear downward trend, implying that Solar demand growth for Silver is becoming less Silver-intensive despite rising module installation (see figure 18).
- This combined impact is effectively narrowing the Silver supply–demand gap, steering the market more towards equilibrium.
Figure 16: Silver – Demand Swings by Sector; all the key segments saw a decline in demand y/y (2025 vs. 2024)
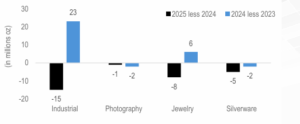
Source: Silver Institute (13 Nov, 2025 Publication, here), HDFC TRU.
Figure 17: Physical market deficit for Silver continues to narrow year-on-year: 2025E Demand is expected to slip to a four-year low, while Supply is anticipated to edge up to three-year highs…
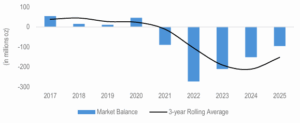
Source: Silver Institute (13 Nov Publication, here), HDFC TRU.
Figure 18: Photovoltaics (PV) cost pressures driving Silver loadings lower (indexed to 100)… using Copper to substitute Silver usage
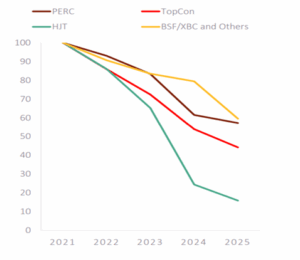
Source: Silver Institute, HDFC TRU.
7. Gold & Silver’s outperformance shows up across the Commodity Complex
- To test whether Gold & Silver are “expensive” (i.e., stretched vs. the rest of the real-asset universe), we look at a ratio framework that compares Gold & Silver against (1) industrial commodities such as Oil and Copper, (2) Broad commodity benchmarks like the Bloomberg Commodity Index (BCOM).
- If Gold & Silver-to-Oil and Gold & Silver-to-Copper ratios are elevated, it suggests that Silver has run significantly ahead of the commodity inputs that typically represent “global activity” (Oil) and “industrial cycle” (Copper).
Figure 19: The Gold-to-Copper and Silver-to-Copper ratios are currently trading at their highest levels in over 30 years…
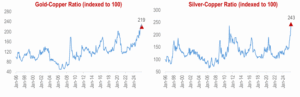
Source: Bloomberg, HDFC TRU. Note: Priced as of 26th December 2025. Data Period: Jan-1996 to Dec-2025.
Figure 20: The Gold-to-Oil and Silver-to-Oil ratios are also trading at their highest levels in over 30 years…

Source: Bloomberg, HDFC TRU. Note: Priced as of 26th December 2025. Data Period: Jan-1996 to Dec-2025.
Figure 21: The Gold / Silver-to-Bloomberg Commodity (BCOM) Index ratio is also at its highest level in over 30 years…
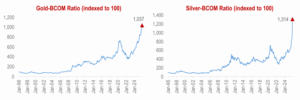
Source: Bloomberg, HDFC TRU. Note: Priced as of 26th December 2025. Data Period: Jan-1996 to Dec-2025.
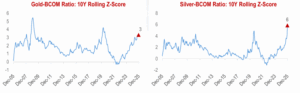
Figure 22: Gold & Silver Relative Valuation vs. Bloomberg Commodity Index (10-year Rolling Z-scores)
Source: Bloomberg, HDFC TRU. Note: Priced as of 26th December 2025. Data Period: Jan-1996 to Dec-2025.
Net-net, based on 10-year rolling Z-scores vs. the Bloomberg Commodity Index (BCOM), Precious metals appear meaningfully stretched. Gold, with a Z-score of around +3, is already trading well above its long-term relationship with the broader commodity complex, suggesting more asymmetric forward returns and a higher likelihood of consolidation. Silver, however, is an extreme outlier, with a Z-score close to +6, indicating it has vastly outperformed the overall commodity basket by historical standards. Such elevated readings do not imply an immediate correction, but they do point to significantly higher volatility and downside risk, with Silver appearing far more extended than Gold at current levels.
8. Even from a technical perspective, both Gold and Silver are currently trading in “Overbought” territory
- Momentum indicators such as RSI signal stretched conditions. Historically, such phases of technical exuberance in Precious metals have rarely been sustained without a period of consolidation or correction.
- Importantly, this matters because drawdowns in Precious metals can be severe. Despite their safe-haven perception, both Gold and Silver have experienced large peak-to-trough declines in past cycles, with Silver in particular exhibiting sharp and rapid corrections due to its higher volatility and dual industrial–investment nature.
Figure 23: Technical indicators like the RSI suggests both Gold and Silver are trading in Overbought territory…

Source: Bloomberg, HDFC TRU. Note: Priced as of 26th December 2025.
Figure 24: Silver is currently trading at ~30% above its Upper Bollinger band…the widest divergence since 1980
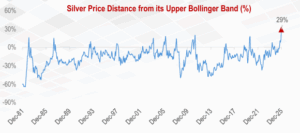
Source: Bloomberg, HDFC TRU. Note: Priced as of 26th December 2025.
Figure 25: Drawdowns in Precious Metals (especially Silver) tends to be severe…

Source: Bloomberg, HDFC TRU. Note: Intra-year Drawdowns are calculated using monthly data.
Our Take: Why the risk–reward in Precious metals has become increasingly asymmetric?
- Positioning and Financialization Add to Volatility. High levels of financial participation and concentration through ETFs increase sensitivity to changes in investor sentiment. In such environments, price movements can be amplified in both directions, raising the risk of abrupt corrections.
- History Shows Drawdowns Can Be Deep. Precious metals are often perceived as defensive assets, yet historical data shows they are prone to large and prolonged drawdowns. Silver, in particular, has experienced severe intra-year and cycle-level declines, underscoring its higher downside risk during periods of exuberance.
- Valuations Are Stretched on a Relative Basis. Both Gold and Silver are trading at elevated levels versus the Bloomberg Commodity Index, indicating meaningful outperformance relative to the broader commodity complex. Rolling Z-scores place Gold in stretched territory, while Silver stands out as an extreme outlier, highlighting valuation excess rather than a broad-based Commodity cycle.
- Silver’s Supply–Demand Tailwinds Are Moderating. While long-term structural themes such as energy transition remain supportive, near-term demand growth, especially from solar, faces headwinds from technology-led Silver substitution. This reduces the likelihood of sustained upside driven purely by physical tightness.
- Technical Indicators Signal Overbought Conditions. Momentum indicators suggest both Gold and Silver are currently overbought, a phase that has historically preceded consolidation or corrective moves. Such technical setups tend to compress forward returns, even if absolute prices remain elevated for some time.
- Portfolio Implication. At current levels, Precious metals, particularly Silver, offers asymmetric risk-reward, with limited upside and elevated downside volatility. We believe this environment calls for prudence, selective exposure, and active risk management, rather than incremental allocation chasing recent performance.


 2024 HDFC TRU