
Indian equity markets have undergone a sharp and broad-based correction, with the pain most acutely felt beyond the headline indices, with nearly 65% of stocks (market cap > INR 1,000 cr), down more than 30% from their peak. A confluence of signals across valuations, earnings, market breadth, now points to the market being in its final corrective phase. We believe that the current market level presents a compelling entry point and expect the markets to bottom out well before the Middle-East conflict ends.
The evolving situation in the Middle-East has understandably raised questions among investors. Through this note, we address your most frequently asked questions (FAQs).
Q. What exactly triggered the “Market Selloff” ?
A. On February 28, the USA and Israel worked together to bomb Iran’s nuclear sites, missile bases, and military headquarters. These attacks killed Iran’s top leader, “Ayatollah Ali Khamenei”, along with many other high-ranking officials. In response, Iran has fought back by attacking U.S. military bases in the Middle-East and launching missiles and drones at the UAE and other neighbour countries like Qatar, Saudi Arabia, etc.
Q. What happens to Oil Prices due to the disruption in Iran ?
A. Oil supplies will likely be interrupted for a little while. This is because it’s becoming more expensive to insure ships, and many tankers are stopping or slowing down their trips to the Middle East. While we don’t think the main trade routes (e.g. Strait of Hormuz) will close completely, the overall flow of oil will be slower and expect this disruption to be temporary in nature.
The Strait of Hormuz is one of the world’s most important shipping routes, and its most vital oil transit choke point. The corridor is only about 50km wide at its entrance and exit, and about 33km wide at its narrowest point and connects the Gulf with the Arabian Sea. In 2025, about 20 million barrels of oil passed through the Strait of Hormuz per day, according to estimates from the US Energy Information Administration (EIA), that’s nearly $600bn worth of energy trade per year.
To help keep prices steady, the OPEC countries are expected to provide an extra 2 mb/d of Oil. Net-net, we don’t expect oil prices to stay high for long. We note that a similar thing happened last year as well in June 2025 (Israel-Iran conflict), where Brent crude witnessed a sharp rally, climbing from around $64/bbl at the end of May to $77/bbl in just a few weeks. In our Deep-Dive note published last year (here), we highlighted that we don’t expect to see “Higher-for-Longer Oil Prices” as the global Oil markets fundamentally remain very well balanced.
Figure – 1: Map of “Strait of Hormuz”
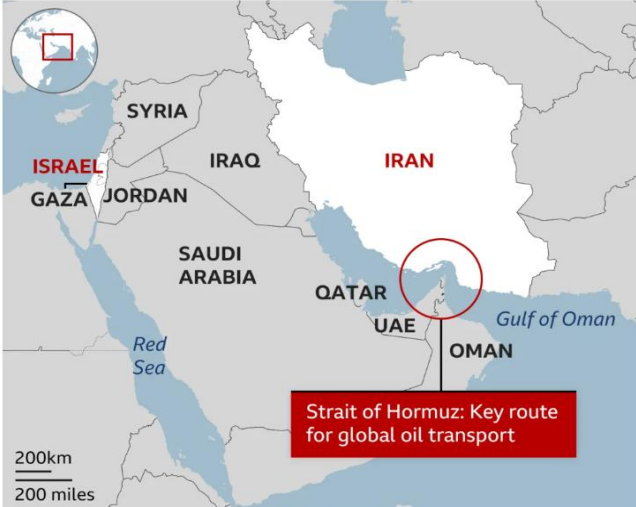
Source: BBC.
Q. What this means for India from a macro stand-point ?
A. If Oil prices do go up, it’s generally bad news for the Indian economy.
Q. What are the implications for Indian Equities ?
A. The Indian indices have shown increased insulation from the adverse effects of sustained high oil prices, primarily driven by the “falling intensity of oil in GDP”.
Even during the Russia-Ukraine conflict in Feb-2022, when Brent prices had touched close to $120/bbl, Indian equities did see a short-term negative impact over the next 3-months, but quickly recovered and delivered strong returns of ~7.5% and ~17% on a 1-year and 2-year basis, respectively.
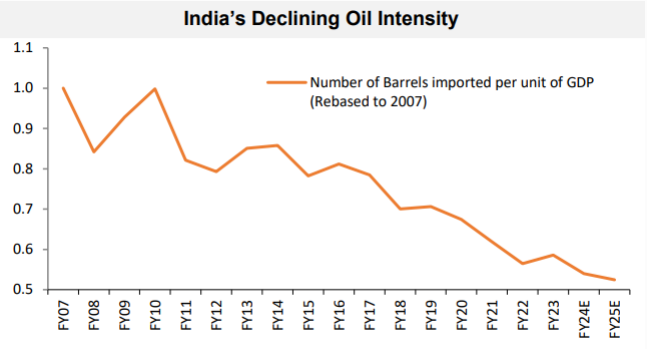
Source: CEIC, RBI, RIMES, IBES, MSCI, Bloomberg, Morgan Stanley Research Estimates.
Our analysis further reveals a notable decline in the correlation between Oil prices and Indian equity returns over the recent decade (CY2016-2025) when compared to the preceding decade (CY2006-2015). While traditionally, elevated oil prices have correlated with dampened equity returns due to pressure on corporate profitability, this trend suggests a fundamental shift, rendering the Indian equity market less susceptible to prolonged periods of high oil prices.
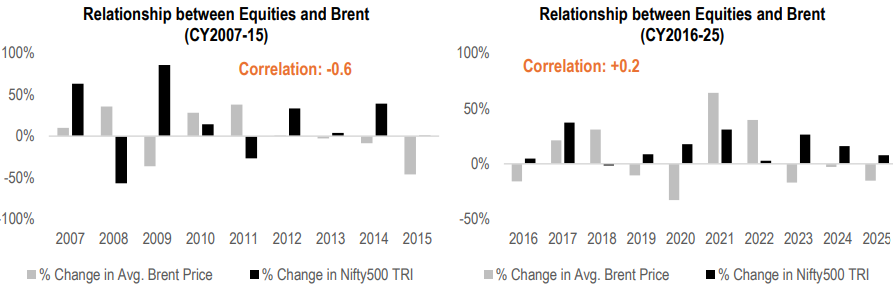
Source: Bloomberg, Investing.com, NSE.
Q. What History Tells Us?
A. If we look at all the conflicts since the beginning of this decade, we see that:
Figure – 2: Market Impact due to Geopolitical Events
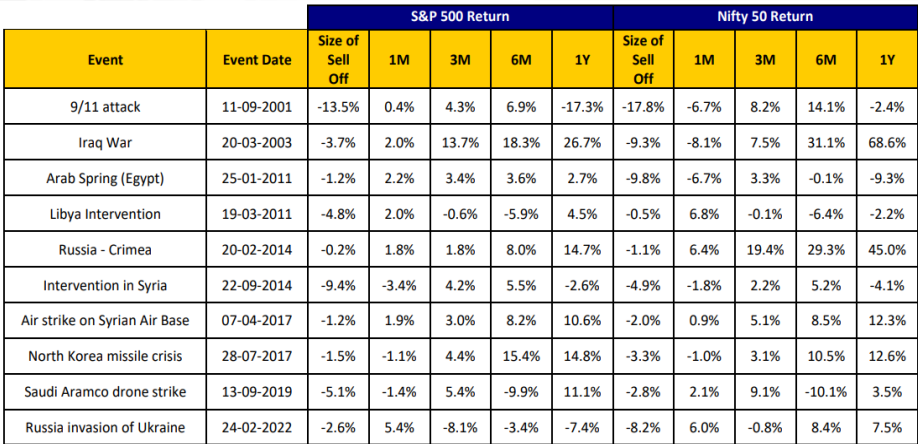
Source: Valentis.
Q. Where do Indian Equities currently stand in terms of “Valuations” ?
A. Over the past 12-18 months, India’s stock market has shown a strange dichotomy. On the surface, the main stock indices are near all-time highs (e.g. Nifty50 is just c.6-7% below its record peak level), but under the hood, many individual companies are actually struggling. Of the top listed companies by market capitalisation (threshold: ₹1,000 crores), the damage increases sharply as one moves down the market cap spectrum, a pattern historically consistent with market bottoming conditions rather than a mid-cycle slowdown.
Table – 1: Drawdown from All-time Highs for BSE-listed companies with Mkt. Cap > INR 1,000 crores
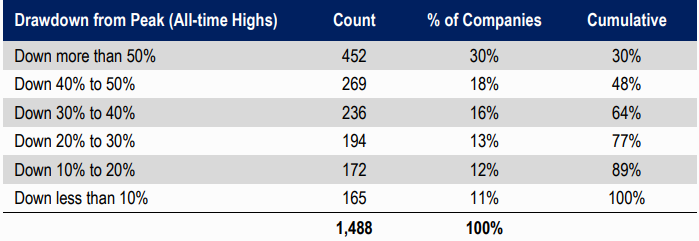
Source: Capitaline, HDFC TRU. Priced as of 26 February, 2026.
Table – 2: Drawdown from All-time Highs for BSE-listed companies by Market Cap (threshold: INR 1,000 crores)
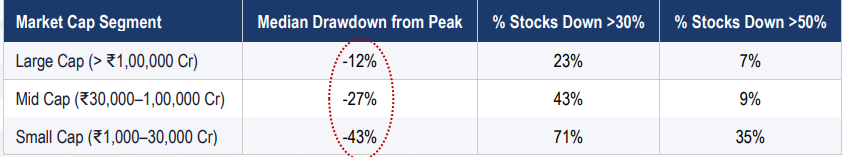
Source: Capitaline, HDFC TRU. Priced as of 26 February, 2026.
Table – 3: Nifty Indices Valuations have undergone a healthy correction over the last 18 months or so…
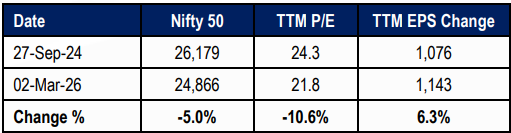
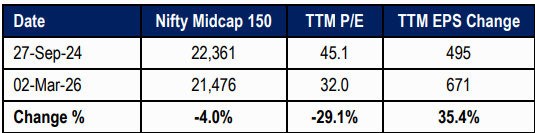
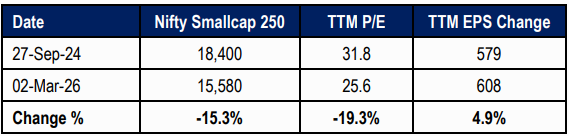
Source: NSE, HDFC TRU. Priced as of 02 March, 2026.
Note: TTM EPS numbers have been back-calculated using the Index value and P/E numbers.


 2024 HDFC TRU