The India VIX, often called the ‘fear gauge’ of Indian equities, measures market participants’ expectations of near-term volatility. It often sees sharp increases during periods of heightened uncertainty, such as geopolitical tensions, election results, major economic policy changes etc., reflecting the market’s reaction to significant macro events. It is derived from NIFTY option prices and reflects the expected annualized change in the NIFTY 50 index over the next 30 days. It is calculated using Black-Scholes model inputs from the prices of near-term and mid-month Nifty option contracts.
| VIX Value | Market Sentiment | Interpretation |
| 10-15 | Calm | Indicates low volatility; more stable, less stressful periods in the markets. |
| 15-20 | Neutral | Mild concerns, normal market fluctuations expected. |
| 20-30 | Caution / Uncertainty | Market expects increased risk due to earnings, policy changes, global events, etc. |
| 30+ | Panic / Fear | High anxiety often during crises, corrections or geopolitical tension. |
Spikes in VIX typically coincide with heightened uncertainty (elections, geopolitical shocks, economic crises etc.), leading to sharp drawdowns. However, history shows that periods of extreme volatility is often followed by robust equity market rallies.
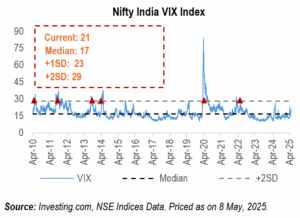
| VIX >29
(+2 Std. Dev.) |
6M
Return (%) |
1Y Return (%) |
2Y Return (%) |
| 05-Feb-10 | 17% | 16% | 7% |
| 09-Aug-11 | 6% | 7% | 6% |
| 22-Aug-13 | 14% | 48% | 25% |
| 11-Apr-14 | 17% | 31% | 8% |
| 09-Mar-20 | 9% | 45% | 27% |
| 24-Feb-22 | 9% | 9% | 18% |
| MEDIAN | 12% | 23% | 13% |
Source: Investing.com, NSE Indices Data. Priced as on 8 May, 2025.
Extreme volatility is emotionally challenging, but historically it has also marked the start of major bull runs. For investors with a long-term lens, India VIX is not a red flag, it’s a green light with caution.


 2024 HDFC TRU