
Indian equity markets have seen a material correction over the past 18 months or so, bringing valuations back in-line with long-run averages and creating an attractive entry point. The current sell-off is majorly driven by geopolitical uncertainty, elevated oil prices and continued FII outflows. India’s GDP growth trajectory, corporate earnings growth and domestic inflows remain firmly intact; therefore, we view the current pullback as an opportunity and recommend adding to equity exposure at current levels.
Executive Summary
The Nifty500 Index has declined ~12% from its Sep-24 peak, a correction that, when viewed against India’s own market history, represents a compelling entry opportunity rather than a cause for alarm. The pullback in Indian equities was primarily driven by global risk-off sentiment linked to geopolitical uncertainty, sustained period of Foreign Institutional Investor (FII) outflows and INR weakness. Critically, none of these factors have structurally impaired India’s growth outlook. Every comparable drawdown in the history of Indian equity markets has usually been followed by a meaningful recovery.
Infact, Indian equity valuations have also now normalized after a period of strong premium pricing. With domestic fundamentals intact and macro tailwinds aligning, we recommend adding to equity positions at current levels.
Indian equities have emerged as a notable global laggard since the beginning of CY 2025…
While India’s market has historically been a powerhouse of growth, the narrative has shifted significantly over the last two years. Data since CY25 indicates that Indian equity indices have faced a challenging period, trailing behind their global peers.
Table – 1: Equity Markets Performance Snapshot of the 13 Major Global Economies
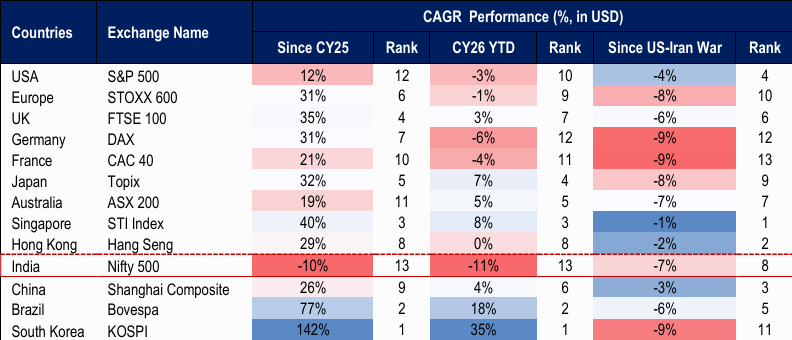
Source: Bloomberg, HDFC TRU. Note: Priced as of 18 March, 2026.
Valuations “froth” have finally settled
At ~18x forward earnings, both the Sensex / Nifty50 are trading below their respective 10-year averages. Similarly, Small & Midcaps (SMIDs) have also seen a material correction (both time and price) with the 12-month forward P/E for Nifty Midcap100 at 25.1x (vs. peak of 35.3x) and Nifty Smallcap100 at 21.6x (vs. peak of 26.4x).
Key Highlights:
Table – 2: Indian Equity Indices Valuation Snapshot
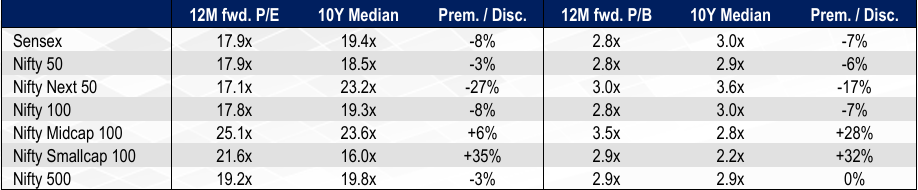
Source: Bloomberg, HDFC TRU. Note: (1) Priced as of 17 March, 2026; (2) The 12M fwd. P/E is calculated using the 12M Blended Fwd. EPS.
While index-level valuations provide a quick snapshot, they often mask underlying realities due to the heavy weight of a few mega-cap stocks. To get a clearer picture of the broader market, we also looked at the median multiple of individual stocks within the Nifty 500, ensuring that outliers don’t skew the results. Our analysis reveals that while valuations remain on the richer side, the froth has noticeably dissipated; median multiples have corrected significantly from the peak of 49x seen in September 2024 and are now gravitating back toward their long-run averages.
Figure – 1: Median trailing monthly P/E for Nifty500 constituents still rich…but have significantly corrected from the peak multiple of ~49x in September-24…
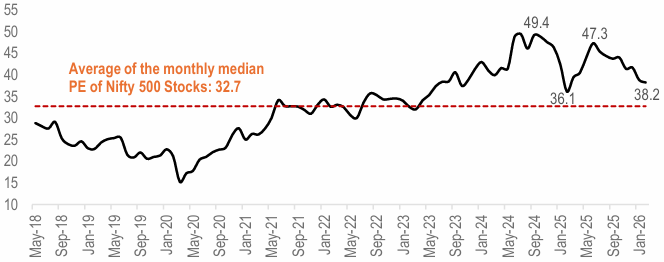
Source: Capitaline, Ace MF, HDFC TRU. Note: Priced as on 27 Feb, 2026.
Drawdown Analysis
While the headline Nifty50 remains resilient on the surface, a deeper look at the broader market, specifically companies with a market cap above ₹1,000 crores, reveals significant underlying distress. The damage intensifies sharply as you move down the market cap spectrum, with smaller players bearing the brunt of the correction.
Figure – 2: Median Drawdown from 52-Week Highs
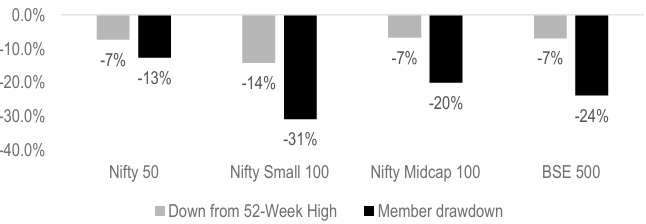
Source: Capitaline, HDFC TRU. Note: Priced as on 6 March, 2026.
Table – 3: Historical Stress Episode Scorecard for the Nifty 500 since 2000
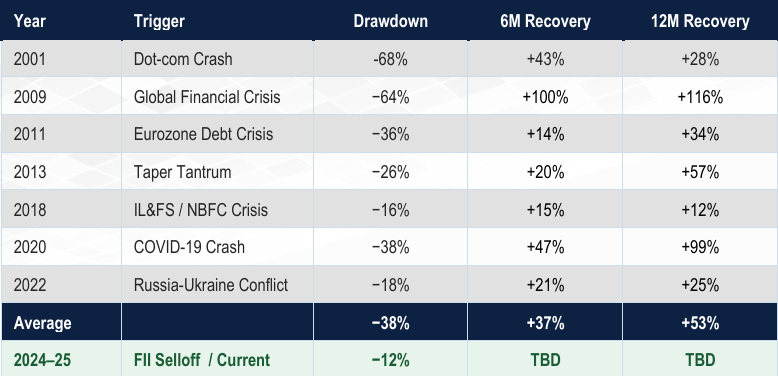
Source: ACE MF, HDFC TRU. Note: Priced as on 17 March, 2026.
Rolling Returns Historical Analysis
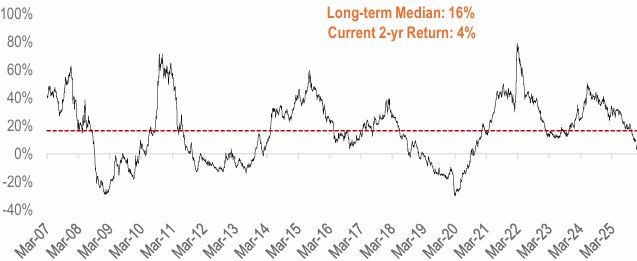
Historically, whenever the Sensex delivers stagnant, low single-digit returns over a two-year period, it suggests that large-cap valuations have time-corrected and investor pessimism has likely peaked. This phase of underperformance frequently clears the way for “mean reversion” where the following 12 months see outsized gains as earnings growth catches up to price.
Table – 4: Low 2-year Rolling Sensex returns = Strong next 12-month Upside…
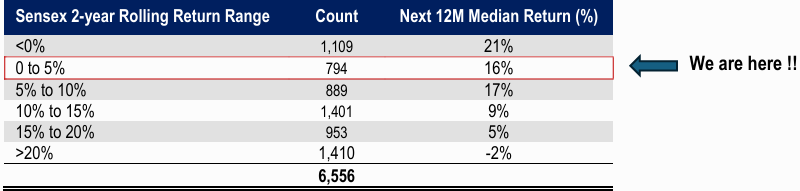
Source: ACE MF, HDFC TRU. Data Period: 1 Apr-2005 to 17 Mar-26.
Figure – 3: Sensex 2-year Trailing Rolling Returns (%)
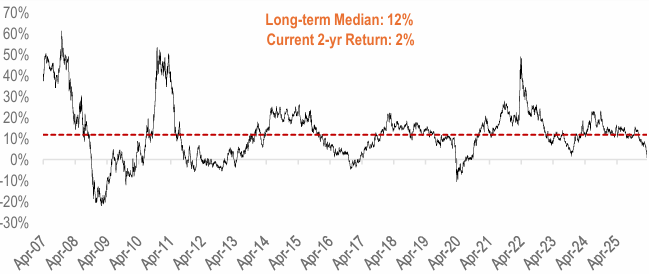
Source: ACE MF, HDFC TRU. Data Period: 1 Apr-2005 to 17 Mar-26.
Even Small and Midcaps (SMIDs) have seen aggressive price correction, with the 2-year rolling returns compressing significantly, and is now hovering well below historical long-term averages. While we are not dismissive of the risks, therefore, we recommend building exposure in tranches rather than a single lump-sum deployment in quality small and midcaps.
Figure – 4: Nifty Midcap 150 2-year Trailing Rolling Returns (%)
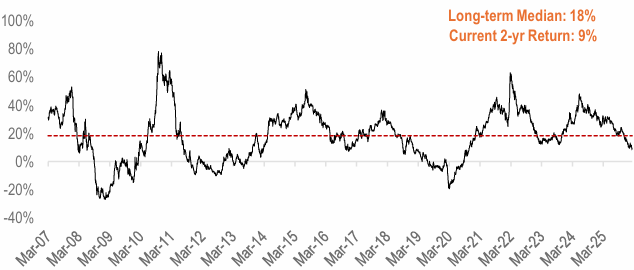
Source: NSE, HDFC TRU. Data Period: 1 Apr-2005 to 17 Mar-26.
Figure – 5: Nifty Smallcap 250 2-year Trailing Rolling Returns (%)
Source: NSE, HDFC TRU. Data Period: 1 Apr-2005 to 17 Mar-26.
Our View: The Fundamental Case for India Remains Intact
The selloff has been driven by foreign outflows and geopolitical uncertainty, and not due to deteriorating domestic fundamentals. We highlight the following structural supports:
However, elevated crude oil prices remain a significant near-term headwind for Indian equities, historically acting as a catalyst for inflationary pressure and margin compression across the corporate sector. As a massive net importer, India’s fiscal resilience is inherently tied to global energy cycles. While these costs currently weigh on the equity markets, a decisive resolution to the conflict in the Middle East could pave the way for a sharp V-shaped recovery.


 2024 HDFC TRU