Entering 2026, global bond markets are undergoing a significant repricing. Despite a cooling phase in late 2025, long-term yields have surged in January, driven by a “perfect storm” of fiscal expansion, intensified competition for capital and shifting central bank dynamics. The US 10-Year Treasury yield has climbed back toward 4.3%, while international benchmarks, including Japan’s long-term bond yields surging to record-highs, signaling a global trend.
Executive Summary:
Global bond yields have moved significantly higher in a synchronised manner across major developed economies, marking a decisive shift away from the ultra-low yield regime that defined the post-Global Financial Crisis (GFC) era. What makes this phase distinctive is that the rise is no longer confined to the United States (USA) alone; yields are also resetting meaningfully in Japan as well as in Europe (e.g., France, Germany), reflecting deeper structural changes in inflation dynamics, fiscal policy, and central bank behaviour.
- In the US, resilient growth and sticky services inflation have forced markets to reprice the path of rate cuts, keeping long-end yields elevated. The term premium has risen as investors demand greater compensation for duration risk amid large fiscal deficits and heavy bond issuance. This has reinforced the idea that interest rates may remain structurally higher than pre-pandemic norms.
- In Europe, particularly in France and Germany, bond yields have risen as inflation persistence, fiscal slippage, and increased sovereign supply challenge assumptions of permanently low rates. The widening focus on fiscal sustainability and defence- and energy-related spending has added upward pressure on yields, even as growth remains uneven.
- Japan represents a more profound regime shift. After decades of yield suppression, incremental policy normalisation and rising domestic inflation have allowed Japanese government bond yields to move higher. Even modest increases in Japanese yields carry outsized global implications, given Japan’s role as a major exporter of capital and a long-standing anchor of global carry trades.
Taken together, the rise in global bond yields signals a return of price discipline and cost of capital across markets. Higher yields are no longer a local phenomenon but a global adjustment, reshaping valuation frameworks across equities, credit, currencies, and real assets.
Figure 1: US, Japan, Germany, and France 10-year government bond yields
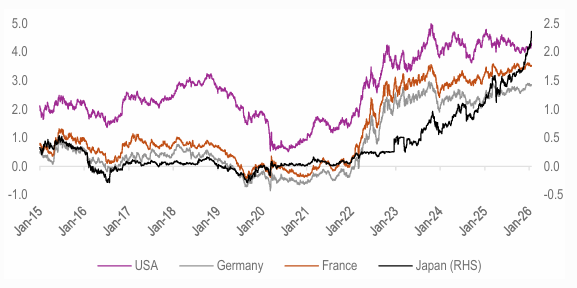
Source: Bloomberg, HDFC TRU. Note: Priced as on 20 Jan 2026.
Analysis of Japan’s Shifting Yield Curve:
- The simple explanation for the material steepening of the Japanese government bond (JGB) yield curve is that nominal GDP growth has been rising of late in Japan. Its nominal GDP growth has risen from a pre-Covid low of 0.5% y/y in 2019 to 4.1% y/y in 3Q25 and 4.9% y/y in the first three quarters of 2025.
- Moreover, we note that the JGB yield curve is also being driven by a significant shift in behavior among domestic insurance companies. These institutions have moved away from purchasing long-dated bonds (10Y+), as the necessity to “reach for yield” has diminished. Since May 2024, when the 10-year JGB yields surpassed 1%, insurers have been able to meet their asset-liability requirements without seeking riskier or longer-duration positions.
- In addition, soft demand in the auction for long-term Japanese bonds this week, further acted as the “last straw,” causing prices to crash and yields to skyrocket because there simply weren’t enough buyers.
Figure 2: Japan 10-year, 20-year, 30-year and 40-year JGB yields
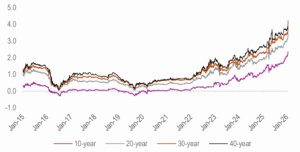
Source: Bloomberg, HDFC TRU. Note: Priced as on 20 Jan 2026.
Calm before the Storm?
- The MOVE index tracks implied volatility on US Treasury options across key maturities. In that sense, it is the bond-market equivalent of the VIX, but specifically for US Treasuries.
- Despite the sharp rise in global sovereign yields, the MOVE index, has remained relatively contained. This suggests that, so far, markets are viewing the increase in yields as an orderly repricing rather than a disorderly shock, with expectations adjusting in a gradual and controlled manner. However, this calm warrants close monitoring.
- Any sharp move higher in the MOVE index would signal rising stress in sovereign bond markets and could have broader cross-asset implications. As such, the MOVE index remains a critical indicator to track in the coming days / months.
Figure 3: The MOVE Index (Volatility Gauge for US Treasuries)
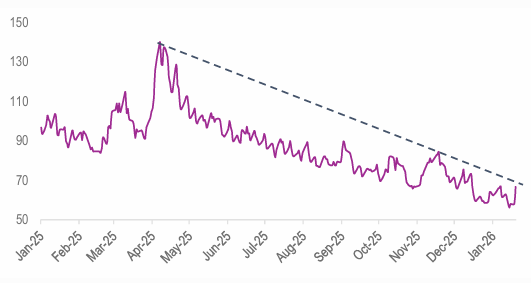
Source: Bloomberg, HDFC TRU. Note: Priced as on 20 Jan 2026.


 2024 HDFC TRU