
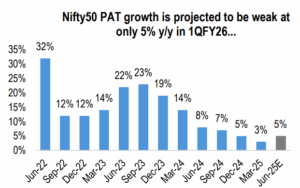
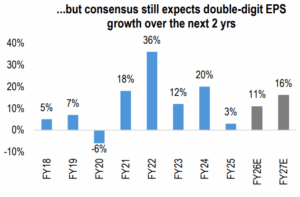
Indian equities remain richly valued, with the mid and small-caps trading well above their respective historical averages. Large-caps, while also premium-priced, offer relatively better value and stability. Earnings growth has been underwhelming, with FY25 at just 3% for the Nifty50 and a tepid start expected for FY26. However, market optimism appears to be riding on ambitious earnings expectations, especially for mid and small-caps, leaving little margin for error. A cautious, bottom-up approach focused on high-quality names, with a bias toward large-caps, is prudent.
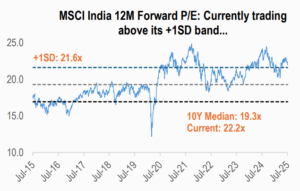
India’s equity markets have witnessed a remarkable journey over the last few years, driven by a confluence of structural reforms, demographic dividends, robust domestic liquidity, and rising investor confidence. As we look at the current valuation landscape, it becomes imperative to assess whether the optimism is supported by fundamentals or if the market is entering stretched territory.
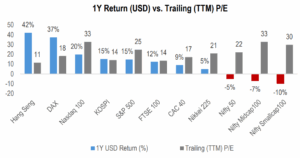
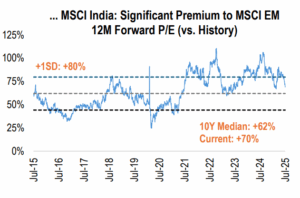
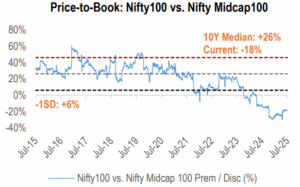
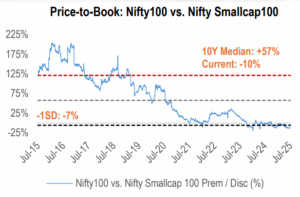
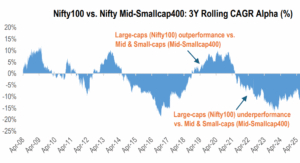
Even after recent corrections, the Indian equity market continues to trade at a substantial premium. This holds true against both its historical averages and its global peers. However, within this elevated landscape, large-cap stocks present a comparatively more attractive entry point. They appear cheaper than mid and small-cap stocks, a trend evident in both their Price-to-Earnings (P/E) and Price-to-Book (P/B) ratios.
Source: Bloomberg. Note: Priced as on 31 July, 2025.
| 12M fwd. P/E | 10Y Median | Prem. / Disc. | TTM P/B | 10Y Median | Prem. / Disc. | |
| Nifty 50 | 20.3x | 18.3x | +11% | 3.4x | 3.1x | +9% |
| Nifty 100 | 20.7x | 19.0x | +9% | 3.4x | 3.3x | +4% |
| Nifty Midcap 100 | 26.5x | 22.9x | +16% | 4.2x | 2.6x | +61% |
| Nifty Smallcap 100 | 25.4x | 15.7x | +62% | 3.8x | 1.9x | +99% |
Source: Bloomberg. Note: (1) Priced as on 31 July, 2025; (2) The 12M Forward P/E is calculated using the 12M Blended Forward EPS.
Source: Bloomberg. Note: Priced as on 31 July, 2025.
Source: Bloomberg. Note: Priced as on 31 July, 2025.
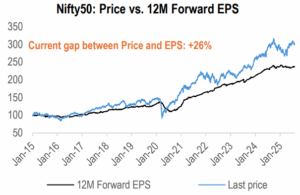
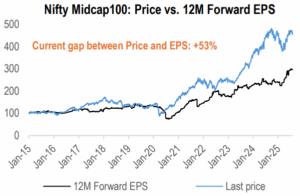
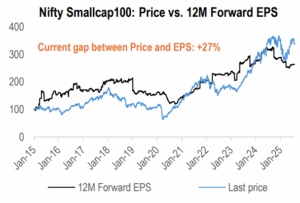
In the dynamic world of financial markets, numerous factors influence stock and index prices daily, from economic data releases and geopolitical events to market sentiment and speculative trading. However, when we zoom out and examine the trajectory of asset prices over extended periods: earnings serve as the primary determinant of a stock’s or index’s price trajectory over the long term. The two are closely linked and will always converge.
Source: Bloomberg. Note: Priced as on 31 July, 2025.
Source: Bloomberg. Note: Priced as on 31 July, 2025.
Source: Bloomberg, Valentis Research.
Source: Bloomberg. Note: Priced as on 31 July, 2025.
Source: Bloomberg. Note: Priced as on 31 July, 2025.
| Dec-24 | Dec-25 | Dec-26 | Dec-27 | |
| Nifty 100 | 1,086 | 1,113 | 1,306 | 1,459 |
| y/y (%) | 30% | 3% | 17% | 12% |
| Nifty Midcap 100 | 1,385 | 1,917 | 2,357 | 2,735 |
| y/y (%) | 2% | 38% | 23% | 16% |
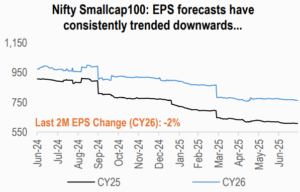
| Nifty Smallcap 100 | 660 | 621 | 772 | 924 |
| y/y (%) | 14% | -6% | 24% | 20% |
| Nifty 500 | 883 | 937 | 1,110 | 1,252 |
| y/y (%) | 25% | 6% | 19% | 13% |
Source: Bloomberg. Note: Priced as on 31 July, 2025.
Source: NSE. Note: Priced as on 31 July, 2025.


Investment Charter

 2024 HDFC TRU