
The Indian mutual fund industry has shown significant growth in the past six years, driven by a thriving economy, and increased individual investor participation. The industry’s AUM as a proportion of bank deposits have risen, indicating a shift from traditional savings methods to mutual funds. A key driver has been the substantial increase in equity investments, fueled by retail investors moving from debt products to equity funds. This growth is further supported by the rising popularity of Systematic Investment Plans (SIPs), which have consistently delivered high monthly inflows. The industry’s performance demonstrates its ability to adapt and its durability in a dynamic financial environment.
India’s stock market capitalization to GDP has increased from 95.4% in 2020 to 125.3% in 2025. India’s market capitalization (National Stock Exchange) ended 6.9% higher in FY25 (₹410.9 trillion) as compared to FY24 (₹384.2 trillion) on account of robust market returns particularly in mid and small cap companies. USA’s stock market capitalization to GDP ratio is highest among the countries compared in 2025.
Individual Income Tax Return (ITR) filings have shown a significant increase, rising from 60 million in FY19 to 76 million in FY24. This trend signals a growth in tax compliance, an expanding workforce, and India’s transition towards a more formal economy with greater financial transparency and stability.
Additionally, the Unified Payments Interface (UPI) has seen explosive growth in both volume and value. The volume of transactions grew from 22.3 billion in FY21 to 185.9 billion in FY25, while the value of these transactions increased from ₹41.0 trillion to ₹260.6 trillion during the same period. This surge highlights the role of technological innovation in driving financial inclusion and accelerating the digital economy.
| Parameters (In Mn) | FY21 | FY22 | FY23 | FY24 |
| Indian Population | 1,361 | 1,374 | 1,386 | 1,399 |
| Indians with Smart Phones | 790 | 825 | 875 | 910 |
| No. of demat accounts | 55 | 90 | 114 | 151 |
| No. of Mutual fund investor accounts | 98 | 130 | 146 | 178 |
Source: ICICI Prudential AMC DRHP.
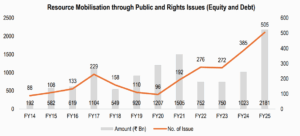
The primary market also saw strong activity in the recent years, As of Fiscal 2025, ₹2,181.2 billion was raised through public and right issue with total 505 issues. The number of issues in FY25 increased by 31.2% from FY24.
Source: ICICI Prudential AMC DRHP.
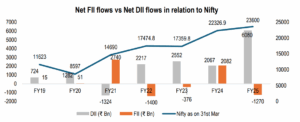
The Nifty rose in Fiscal Year (FY) 2024 due to significant inflows from both Domestic Institutional Investors (DIIs) and Foreign Institutional Investors (FIIs). In FY25, the rise was primarily driven by DIIs.
Source: ICICI Prudential AMC DRHP.
The Indian mutual fund industry has experienced significant growth over the past six years, driven by a thriving domestic economy, substantial inflows, and increased participation from individual investors. The industry is witnessing a surge in growth, driven by the equity space, where assets have increased significantly over the past decade.
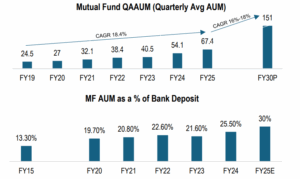
This shift is attributed to retail investors transitioning from traditional debt products to equity funds, resulting in a substantial rise in equity investments. Mutual fund AUM as a proportion of bank deposits in scheduled commercial banks has risen from 19.7% in March 2020 and is estimated to have grown to 30.0% as on March 2025 indicating increase in investor participation in mutual funds.
The fiscal year 2024 was particularly notable, where the industry grew by 33.6% year on year benefiting from a strong equity market, robust economic growth, and heightened investor engagement.
Source: ICICI Prudential AMC DRHP.
In terms of QAAUM, market share of top 10 AMC has decreased from 82.7% as on March 2021 to 76.9% as on March 2025. However, market share in terms of QAAUM of the top 3 bank led AMC has broadly remained stable despite of increase in number of fund houses in the market and increase in number of products offered by the fund houses. As on March 2025, there were 49 registered mutual funds in India.
Source: ICICI Prudential AMC DRHP.
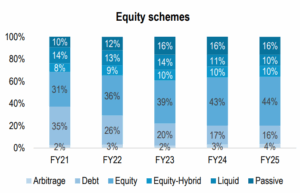
Equity schemes have gained prominence in the last five years.
In fiscal 2025, all categories witnessed positive inflows. Generally, equity and equity-oriented schemes have a higher fee structure compared to non-equity-oriented schemes, on account of being actively managed and incurring more research and analysis costs as compared to other schemes.
Source: ICICI Prudential AMC DRHP.
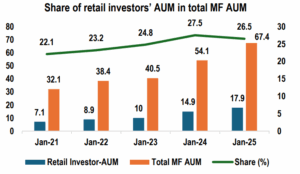
Individual investors are demonstrating increasing confidence in the Indian equity markets, reflected in their growing ownership of NSE-listed companies. This trend is significantly bolstered by the rising share of mutual funds in household financial savings, driven by the anticipation of higher and more stable returns, which is expected to fuel inflows into passive and equity fund categories. As of March 31, 2025, retail investors’ total Mutual Fund AUM, including Fund of Funds Scheme (Domestic), reached ₹17.9 trillion, making up 26.5% of the overall MF AUM. This growth was predominantly driven by retail investors’ strong interest in equity-oriented and gold ETF mutual fund schemes, with their AUM in equity-oriented schemes specifically amounting to ₹16.4 trillion, representing 46% of the total equity AUM.
Source: ICICI Prudential AMC DRHP.


 2024 HDFC TRU