As the macro landscape continues to evolve in 2025, investor portfolios can benefit from selective global exposures beyond India. We highlight three global themes drawing strong attention beyond India: 1) Gold Miners for leveraged upside to record gold prices; 2) U.S. 30-Year Treasuries (long bonds) to lock in multi-year-high yields and potential capital gains; 3) Semiconductors to capture the AI-driven tech supercycle. In the current market context, diversification beyond Indian equities will help investors mitigate concentration risks as well as participate in structural opportunities unfolding globally.
Executive Summary:
Global markets in 2025 are navigating a multi-layered environment: moderating CPI inflation in developed economies, persistent fiscal deficits, divergent central bank policy paths, and a re-ordering of geopolitical alliances. Equity markets have delivered selective gains, but dispersion across sectors and geographies is widening. In this context, strategic asset allocation demands a mix of high-quality income sources and structural growth opportunities that extend beyond the domestic investment universe.
This note highlights three global investment themes with strong investment merit, particularly where Indian markets currently offer limited direct access:
- Gold Miners: Leveraged exposure to sustained gold price strength, driven by central bank accumulation, currency debasement concerns, and emerging market demand. Gold miners have begun to outperform the underlying metal in 2025, offering attractive earnings leverage and valuation upside.
- S. 30-Year Treasuries: Long-duration U.S. government bonds are currently yielding near multi-year highs, offering a rare chance to lock in attractive real returns for the long term. While duration risk remains a key consideration, the strategic appeal is amplified by the potential for significant capital gains if inflation moderates / economic growth slows.
- Semiconductors: A critical enabler of AI, 5G, EVs, and cloud infrastructure, dominated by non-Indian players. The sector remains structurally poised for growth despite short-term cyclicality.
Our analysis blends macro drivers, valuation metrics, and performance data, providing both tactical and strategic considerations.
- Global Investment Theme – 1: Gold Miners

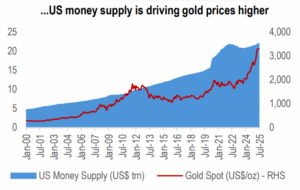
Summary: We believe that Gold’s long-term outlook remains well-supported driven by strong global / US money supply growth, de-dollarization trends and continued central banks demand. However, in our view, gold mining equities are in an even better position to capitalize on this positive environment. The gold mining sector has emerged out from a period of rising costs, suggesting that profit margins will be strong and cash flow returns will continue to benefit from high gold prices. Moreover, the valuations of major miners are at very attractive levels indicating significant upside potential.
Investment Rationale:
- Positive long-term outlook on Gold: We believe several factors point to a constructive outlook for gold’s future performance – i) Central banks are expected to continue purchasing gold, which will help to support its price and attract investors; ii) anticipated market instability due to Trump’s economic policies is likely to increase interest in gold; iii) easing inflation and falling interest rates should provide support; iv) the trend of de-dollarization, especially in emerging markets and v) Strong global money supply growth.
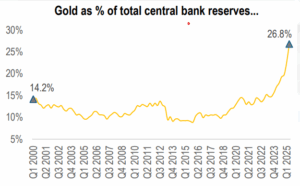
Source: World Gold Council, Bloomberg, HDFC TRU. Note: Priced as on 31 July 2025.
- Global gold output has plateaued: Gold production has hit a plateau, a trend that’s held for the past seven years. This stagnation is a direct consequence of historically low capital expenditure in the mining sector, which has severely limited the discovery of new gold deposits. With very few major gold mining projects on the horizon for the next five to seven years, this flat supply trend is likely to persist. This significant lack of investment in the sector, leading to a plateau in production, could be an early indicator of a “gold supercycle.”
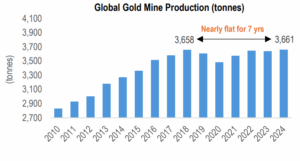
Source: World Gold Council, HDFC TRU.
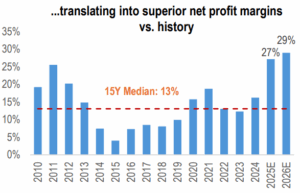
- Efficient management and enhanced governance: After experiencing a significant downturn that followed the bull market of 2011, gold mining companies have significantly changed their practices. In the past, companies often borrowed heavily to finance new, sometimes low-quality mines, which led to high debt and write-downs when gold prices fell. However, over the last decade, these companies have learned to control costs. Their expenses have grown at a much slower rate than the price of gold, which has more than doubled. As a result, many gold mining companies have improved their balance sheets and reduced their debt, making them more resilient to market fluctuations.
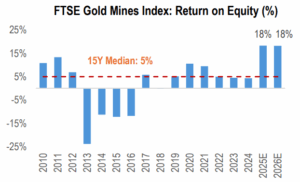
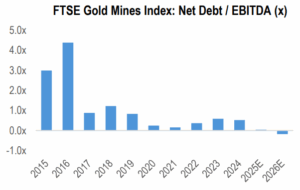
Source: Bloomberg, HDFC TRU. Note: The FTSE Gold Mines Index reflects the performance of the worldwide gold mining companies.
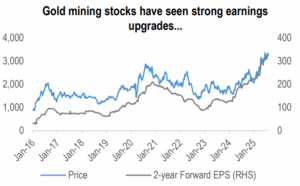
- Earnings upgrades expected to continue:
- Analysts are consistently forecasting lower gold prices in their financial models. As shown in the table below, there is a strong disparity between consensus price forecasts for gold and their respective forward prices. This is poised to drive significant earnings revisions.
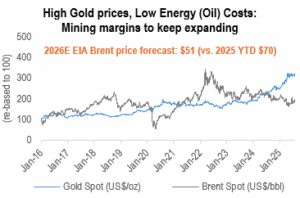
- We also anticipate a consistent uplift in profit margins, fueled by a weak oil price outlook (diesel is a key fuel used in mining operations), and a widening gap between realized gold prices and the All-in Sustaining Costs (AISC). This fundamental shift suggests a strong, positive outlook for the sector.
| Commodity Forward Price Curve |
Spot |
Q3CY25 |
Q4CY25 |
CY2025 |
CY2026 |
CY2027 |
CY2028 |
| Gold Current Forward Price ($/t oz) |
3,366 |
3,359 |
3,405 |
3,257 |
3,499 |
3,602 |
3,780 |
| Analyst Forecast (Median) |
|
3,335 |
3,325 |
3,178 |
3,250 |
3,050 |
2,977 |
| Variance (% chg.) |
|
-1% |
-2% |
-2% |
-7% |
-15% |
-21% |
Source: Bloomberg, HDFC TRU. Note: Priced as on 25 August 2025.
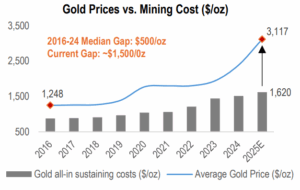
Source: Newmont Corp 10K, Investing.com, Bloomberg, HDFC TRU.
Note: For 2025, the Gold all-in sustaining cost is the guidance issued by Newmont and the Avg. Gold Price is till 31 July, 2025.
Source: Bloomberg, HDFC TRU. Note: Gold mining stocks represented by the FTSE Gold Mines Index.
- Gold ETFs are seeing strong inflows, but mining equities remain relatively under-owned: Despite a compelling bull market in precious metals, investor flows into gold mining equities have been surprisingly absent. Gold Mining ETFs are seeing a decline in number of shares outstanding indicating redemptions are exceeding creations. Since the start of the year, the VanEck Gold Miners ETF (GDX) and the VanEck Junior Gold Miners ETF (GDXJ) have seen unit redemptions of over 20%, reflecting a significant withdrawal of capital from the sector. This mirrors the past behaviour of gold ETFs right before their prices soared and thus presents a compelling opportunity: strong companies trading at bargain prices.
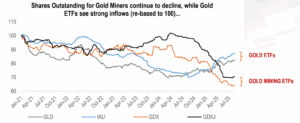
Source: Bloomberg, HDFC TRU. Note: GLD & IAU are Gold ETFs, while GDX and GDXJ are Gold Miners ETF listed in the US.
- Valuations of gold mining stocks at attractive levels: Gold miners are experiencing a period of strong financial performance. They are successfully expanding their profit margins and generating significant cash flows. Furthermore, many companies in the sector have fortified their balance sheets. Despite these positive developments, their stock valuations remain depressed. Key valuation metrics, such as the price-to-free cash flow (P/FCF) and price-to-earnings (P/E) ratios, are trading below their 12-month moving averages and historical norms.
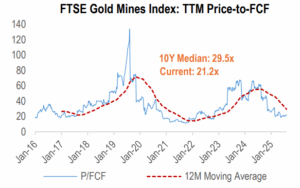
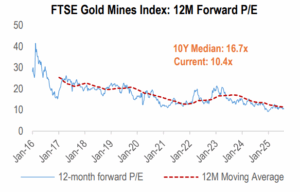
Source: Bloomberg, HDFC TRU. Note: Priced as on 31 July 2025.
Key Challenges and Risks:
- Managing capital discipline. Capital is the main risk for the mining sector. Companies are prioritizing shareholder returns over capital expenditures, which, combined with rising maintenance costs and fewer new gold discoveries, has led to a focus on acquiring existing assets and expanding brownfield projects. This trend is driving industry consolidation, limiting new exploration, and could constrain future gold supply.
- Cost escalations. Rising costs for labour, energy, and taxes are pushing up gold’s total cash costs. This is preventing higher gold prices from fully boosting share prices. To combat this, miners are using technology and long-term labour agreements to improve efficiency and stabilize costs.
- ESG Impact. Gold miners increasingly struggle with ESG compliance as access to capital tightens, investor pressure mounts, and shareholder activism intensifies. Balancing profitability with demands for sustainable practices is a critical challenge for the industry.
Our Take:
- Gold’s long-term outlook is robust. This is primarily driven by increasing investment from individuals and central banks seeking safe-haven assets amid rising global uncertainty.
- Attractive Valuations. Despite this positive trend in gold prices, the valuations of gold mining companies have not yet fully reflected it. To improve valuations, cost management will remain a critical focus, even as gold prices rise.
- Global Investment Theme – 2: U.S. 30-Year Treasuries

Summary: The 30Y US Treasury is a key pillar of global fixed income markets, offering unmatched safety, liquidity, and long-duration exposure. With yields currently elevated relative to historical averages, long bonds present an attractive entry point for investors seeking to lock in risk-free returns for the long-term. While duration risk remains high, any moderation in inflation or signs of slowing growth could drive capital gains, reinforcing the case for strategic allocation. For Indian investors, where direct access is limited, exposure through offshore ETFs or global funds presents a differentiated opportunity unavailable in domestic markets.
Understanding Bond Dynamics: Investors often turn to bonds for their stability and capital protection, however, it’s worth noting that bonds prices can move sharply in response to interest rate changes. The relationship between bond price and its yield is crucial to understand this dynamic. When interest rate (or bond yield) falls, bond price rises and vice versa. Bonds with longer duration exhibit more significant changes in price in response to fluctuations in interest rates. This is measured by modified duration (MD) which represents the change in bond price with change in bond yield.
% change in bond price = – (% change in yield) × (MD)
At 5% coupon rate and yield, MD of 10Y bond is ~8 and that of 30Y bond is ~15. This means that a 1% fall in yield leads to approx. 8% capital gain for 10Y bond and 15% capital gain for 30yr bond. Considering the modified duration of 15 for 30Y bond, below is the scenario analysis of probable change in bond price in US 30yr G-sec with different levels of fall in yield.
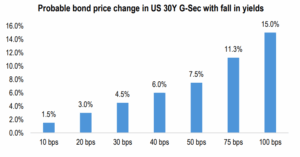
Source: HDFC TRU calculations based on bond dynamics.
Note: Changes in bond price shown above are absolute; accrual gain/coupon income has not been considered.
Investment Rationale:
- Potential for mean reversion: With the India-US 10-year bond yield spread currently near 230 bps (well below its historical averages) there is a potential for mean reversion. If the spread moves back toward its historical range, the adjustment is most likely to play out through a fall in US yields rather than a rise in Indian yields.
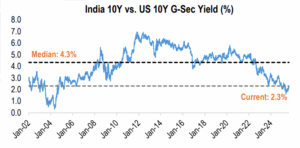
Source: Bloomberg, HDFC TRU. Note: Data as of 22 Aug 2025.
- US Fed Rate Cuts: Fed has maintained its policy rate at 4.25-4.5% since Dec’24 and is widely expected to cut rates soon. As per the CME FedWatch tool, market is factoring 50/75bps cut in Fed funds rate in CY25 with the odds at 49% / 34%, respectively. Cut in policy rates could lead to a fall in government bond yields.
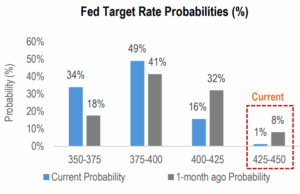
Source: CME FedWatch Tool, HDFC TRU. Note: Data as of 24 Aug 2025.
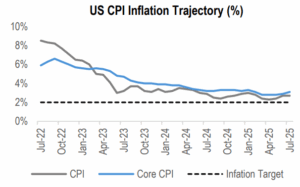
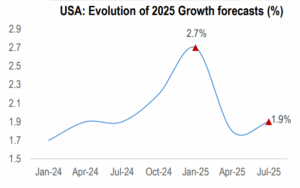
- US Inflation Easing Towards the Fed’s Target: Currently CPI inflation in US is 2.7% (July’25). While not yet at the 2% Fed’s target, steady disinflation could relieve pressure on the Fed to maintain tight monetary policy, a trend that could lower yields.
Source: Trading Economics, HDFC TRU.
- Economic Slowdown or Recession: IMF had lowered US economic growth forecast to 1.9% in July’25 from their earlier estimate of 2.7% in Jan’25. In a slowing economy with a softening labour market and business sentiment, demand for risk-free assets like government bonds could increase.
Source: IMF, HDFC TRU.
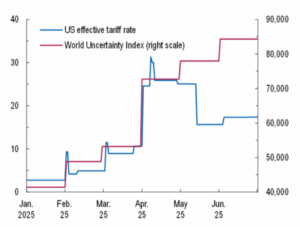
- Potential for Geopolitical / Financial Shocks: New trade tariffs, global political events, or financial market volatility can provoke a “flight to safety,” causing investors rush into Treasuries, leading to fall in yields. The global economic uncertainty index remains high despite a recent decrease in effective tariff rates. The US and China temporarily paused their trade tariffs, but the US is threatening higher tariffs on other trading partners.
Source: IMF, HDFC TRU.
- Moderation in Treasury Supply and Yield Curve Control: While large-scale government borrowing has contributed to high yields, any signals of fiscal improvement or Fed intervention can shift demand in favour of Treasuries, capping or reducing yields.
Key Risks of Investments in US Treasuries:
- Interest Rate Risk: Higher duration bonds are much more sensitive to changes in interest rates. Any adverse movement in bond yields or interest rates could lead to capital loss.
- Currency Risk: For an Indian resident investing in US treasuries, all returns are denominated in US dollars. If the INR depreciates against USD, Indian investors can gain additional return on currency conversion. However, in case the INR appreciates vs. USD, overall INR returns may reduce.
Our Take:
- Interest Rate Sensitivity. For bonds of the same maturity, those with lower coupons and yields, such as U.S. bonds, have a higher Modified Duration (MD). This makes them more sensitive to interest rate changes than higher-yielding alternatives like Indian bonds. As a result, U.S. bonds are more effective for interest rate strategies, offering greater potential for price gains when rates fall.
- Mean Reversion in the yield spread gap. The spread between U.S. and Indian 10Y bond yields has narrowed to a 20-year low of around 230 bps due to the Fed’s hawkish policies and persistent inflation. A return towards the historical average of 430 bps would likely be caused by a decrease in U.S. yields, not an increase in Indian yields.
- Capitalizing on Duration Risk. Despite the ongoing duration risk, any signs of slowing economic growth or moderating inflation could lead to significant capital gains. This potential for price appreciation makes a strategic allocation to U.S. bonds a compelling investment consideration.C. Global Investment Theme – 3: Semiconductors

Summary: The global semiconductor sector experienced significant growth in CY24, with sales reaching $631bn, an increase of 20% y/y and exceeding earlier forecasts. This trend is expected to continue, with a projected $728bn in sales for CY25, putting the industry on track to hit $1trn by 2030. This robust performance is reflected in the stock market, where the top-20 global semiconductor companies’ combined market cap soared to $7.8trn as of 31 July 2025, a 25% y/y increase. As we look ahead, the trajectory of the semiconductor industry is set to be fueled by megatrends such as electrification, digitization, and the accelerating deployment of AI and Internet of Things (IoT) technologies.
Investment Rationale:
- Semiconductors form the backbone of the digital economy: Semiconductors are the fundamental building blocks of virtually all modern technology. From smartphones and computers to electric vehicles (EVs), medical devices, and industrial automation, chips are essential. This ubiquitous demand creates a broad and resilient market for the industry.
- Generative AI chips; key growth driver: For Gen AI chips, the most critical semiconductor segments are Logic and Memory. Logic chips are the “brains” that perform the complex calculations (e.g., GPUs, CPUs, AI Accelerators, etc.) and Memory chips are the “data storage powerhouses.” Gen AI workloads require an immense amount of data, and fast access to this data is crucial. In 2024, the Logic and Memory segment comprised >60% of the overall global sales and are now expected to grow by 29% and 17%, respectively, in 2025.
| Semiconductor Products (YoY %) |
2024 |
2025E |
2026E |
| Discrete Semiconductors |
-13% |
-1% |
9% |
| Optoelectronics |
-5% |
-1% |
3% |
| Sensors |
-4% |
8% |
5% |
| Analog |
-2% |
3% |
5% |
| Micro |
3% |
4% |
5% |
| Logic |
21% |
29% |
9% |
| Memory |
79% |
17% |
18% |
| Total Products |
20% |
15% |
10% |
Source: World Semiconductor Trade Statistics, HDFC TRU.
- Relentless focus on innovation: The industry is relentlessly focused on innovation, driven by the principle of making chips smaller, faster, and energy-efficient. This leads to a constant cycle of new product development and technological breakthroughs, ensuring long-term growth. Key areas of innovation, such as advanced packaging (e.g., TSMC’s CoWoS) and the development of specialized chips, are further cementing the competitive advantage of leading companies.
Source: Deloitte, HDFC TRU.
- Favourable Policy Tailwinds: The semiconductor sector is enjoying strong policy tailwinds as governments worldwide recognize its strategic importance for economic growth and national security. In the US, the CHIPS and Science Act offers large subsidies, tax incentives, and R&D funding to expand domestic capacity, while the EU’s Chips Act targets doubling market share by 2030 through manufacturing and supply chain investments. Asian countries like India, South Korea, and Japan are also offering production-linked incentives, grants, and infrastructure support to attract global foundries and strengthen local ecosystems. These measures address supply chain vulnerabilities exposed during the pandemic and stimulate long-term demand from sectors such as EVs, 5G, AI, and green technologies. Collectively, they are set to accelerate capacity expansion, reduce reliance on concentrated geographies, and support sustainable growth and profitability in the industry.
| Country |
Semiconductor Supply Chain Investments / Incentives |
| US (here) |
To date, $32.5bn in grants have been awarded, and $5.85bn in loans have been approved to 32 companies across 48 projects. In fact, companies in the semiconductor ecosystem have announced over 130 projects across 28 states, totalling more than $600bn in private investments, since 2020. |
| European Union (here) |
EU’s Chips Act provides for policy-driven incentives in excess of €43bn until 2030. It also puts in place a framework to increase production capacity to 20% of the global market by 2030. |
| India (here) |
Union Cabinet in 2021 approved the India Semiconductor Mission (ISM) with a ₹76,000 cr outlay to boost fabrication, design, and manufacturing. Total approved projects under ISM reached 10 with cumulative investments of around ₹1.60 lakh cr in 6 states. |
| Japan (here) |
Japan plans to invest JPY10 trn (US$65 bn) or more by 2030 to boost the country’s chip and artificial intelligence industries via subsidies and other financial incentives. |
| China (here) |
China has promoted its domestic semiconductor industry for a decade through investment funds, including the National Integrated Circuit Investment Fund ($21bn in 2014, $35bn in 2019, and $41bn in 2023) and local funds, along with incentives like tax breaks and loans. Total government investments are estimated to exceed $190bn. |
Source: PwC, Media Reports, HDFC TRU.
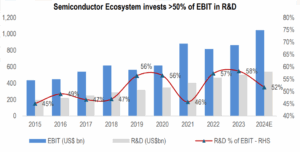
- Attractive Financial Profile: Semiconductor companies deliver superior operating margins, strong cash flow generation, disciplined capital allocation and balance sheet strength. This sets them apart as both a growth sector as well as a cash-generative play, rare in the broader technology universe.
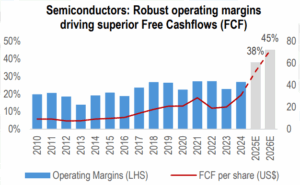
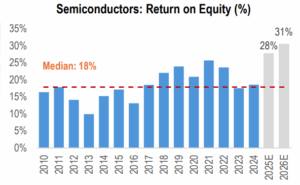
Source: Bloomberg, HDFC TRU. Note: Semiconductor stocks represented by MSCI World Semiconductor & Semiconductor Equipment Index.
- Valuations: In the semiconductor sector, valuations remain one of the most debated aspects of the investment thesis. On an absolute basis, leading players often trade at premium multiples compared to the broader market, reflecting their dominant market positions, secular growth tailwinds, and strong financial profiles. However, when benchmarked against other technology subsectors (such as software), semiconductor valuations appear attractive.

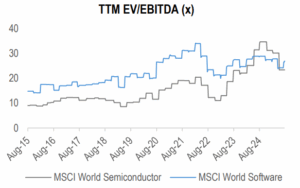
Source: Bloomberg, HDFC TRU.
Key Challenges / Risks:
- The semiconductor industry has historically been extremely cyclical. The semiconductor industry has a history of being cyclical, experiencing periods of both growth and contraction. While the extreme highs and lows seen between 1990 and 2010 have become less pronounced, the frequency of these market contractions appears to have increased.
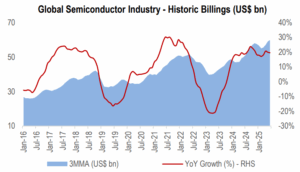
Source: World Semiconductor Trade Statistics, Deloitte, HDFC TRU. Note: MMA stands for Monthly Moving Average.
- Supply Chain Concentration: Semiconductor manufacturing is heavily concentrated in a few geographies, notably Taiwan and South Korea. Rising geopolitical tensions, such as U.S.-China trade restrictions, potential Taiwan conflict risks, or export bans, pose significant threats to supply stability.
- Technological Disruption and Execution Risk: The industry is highly R&D intensive, requiring constant innovation to stay ahead. Failure to advance to the next process node or delays in product launches can lead to loss of market share. At the same time, rapid shifts in technology, such as new architectures, alternative computing models, or breakthroughs in quantum computing, could disrupt existing leaders.
Our Take:
- Structural Growth Story. Semiconductors sit at the heart of the digital economy, enabling technologies ranging from AI, cloud computing, and 5G to electric vehicles and renewable energy. This positions the sector for multi-decade growth, even if near-term cycles create volatility.
- Policy Support. With governments globally recognizing chips as critical infrastructure, the industry is benefiting from unprecedented policy incentives (U.S. CHIPS Act, EU Chips Act, India’s Semiconductor Mission). This enhances supply-chain resilience and underpins a long runway for capacity expansion and profitability.
ANNEXURES:
- UCITS ETF vs US ETFs: Brief Overview and Taxation Impact for Indian Investors ?
| Feature |
UCITS ETF |
US-domiciled ETFs |
| Regulation & Investor Protection |
UCITS stands for Undertakings for Collective Investment in Transferable Securities. It is regulated by a strict European Union (EU) directive. |
Regulated by the laws of the Securities and Exchange Commission in the U.S. |
| Domicile Country |
Ireland / Luxembourg |
USA |
| Availability to Indian Investors |
Can be purchased by Indian investors, often through an international brokerage account. UCITS ETFs are a popular option for European investors and are becoming more accessible globally. |
US-domiciled ETFs are a popular choice for their large size, high liquidity, and competitive fees. Access for Indian investors is typically through an international brokerage platform. |
| Capital Gains Taxation |
The domicile country (e.g., Ireland) generally does not levy capital gains tax on the sale of ETF units by non-residents. However, capital gains are taxed in India based on the holding period [LTCG (>2 yrs) at 12.5%*; STCG (<2 yrs) at income tax slab rate]. |
No tax is payable in the US on capital gains for non-resident investors. However, capital gains are taxed in India based on the holding period [LTCG (>2 yrs) at 12.5%*; STCG (<2 yrs) at income tax slab rate]. |
| Dividends Taxation |
Dividends are subject to withholding tax in the country where the underlying stocks are held. For instance, a Irish-domiciled ETF holding U.S. stocks will be subject to a 15% U.S. withholding tax on dividends (see here). However, in India, the gross dividend amount (before foreign taxes) is added to the total income and taxed as per the investor’s applicable income tax slab rate. Since India doesn’t have a tax treaty with Ireland, there’s no credit mechanism for the 15% fund-level deduction. |
A direct investment in a US-domiciled ETF, is subject to a 30% withholding tax (see here) for Indian residents. The remaining 70% is remitted to the investor. However, in India, the gross dividend amount (before U.S. tax) is added to the investor’s total income and taxed as per the applicable income tax slab rate. The investor can claim a Foreign Tax Credit for the 30% tax already paid in the U.S. to avoid double taxation. |
| Inheritance / Estate Tax |
Domiciled outside the U.S., therefore, the U.S.-based assets are not considered U.S.-situs assets. This is significant because it means there’s no U.S. estate tax exposure. |
For Indian resident investors, the U.S. estate tax can be a significant concern. A tax of up to 40% is levied on the value of U.S.-situs assets that exceed $60,000 at the time of death (see here). Unlike an income tax, this is a tax on the total asset value, posing a substantial risk to high-net-worth portfolios. |
*surcharge and cess as applicable.
Note: Investing in global markets comes with its own set of complexities, and it’s essential for investors to be mindful of tax and regulatory requirements. Additionally, all foreign investments must comply with the RBI’s annual limits and reporting regulations. To avoid compliance issues and unexpected tax liabilities, investors should stay up-to-date on RBI regulations and ensure their investment platforms meet all necessary guidelines. It’s always a good idea to consult a tax advisor for personalized advice before investing in foreign securities.
- UCITS ETF vs US ETFs: What should Indian investors prefer?
For Indian investors, the choice between a UCITS ETF and a US-domiciled ETF depends on two key factors:
- Tax efficiency: The primary tax advantage of UCITS ETFs for Indian residents is the potentially lower withholding tax on dividends. A U.S.-listed ETF is subject to a 30% withholding tax for Indian residents, while a UCITS ETF domiciled in Ireland or Luxembourg that holds U.S. stocks is often subject to a lower 15% withholding tax. However, from an Indian investor’s perspective, accumulating UCITS ETFs are a more tax-efficient choice as dividends never get distributed and are automatically reinvested, which means no Indian dividend tax. However, in case of a distributing UCITS ETF, India doesn’t have a tax treaty with Ireland and therefore there is no credit mechanism for the 15% fund-level deduction. Secondly, a UCITS ETF also doesn’t have any US estate tax exposure, while in case of a US ETF, an estate tax of up to 40% is levied on the value of U.S.-situs assets that exceed $60,000 at the time of death.
- Liquidity and AUM: US-domiciled ETFs are often the largest and most liquid in the world. High liquidity is a significant advantage, as it makes it easier to buy and sell at fair prices.
Net-net, our preferred mode of investment is through the UCITS route given better tax efficiency, and we note that for most investors, UCITS ETF liquidity is more than sufficient, especially those tracking major indices.
- Example and performance of an UCITS-compliant ETF?
Vaneck Gold Miners UCITS ETF is the most common and widely traded UCITS Gold Mining ETF.
- Benchmark: NYSE Arca Gold Miners Index
- Shares Outstanding: 30,300,000.
- TER: ~0.53% p.a.
- Domicile: Ireland
- Focus: Provides exposure to the largest global gold mining companies
- Income Treatment: Re-investment.
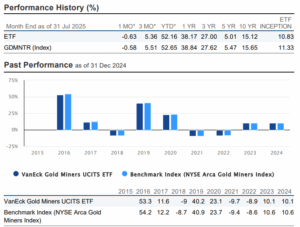
Source: VanEck Gold Miners UCITS ETF Factsheet. Note: *Reference periods indicate cumulative performance, not annualized.
- List of major Domestic ETFs that offer overseas equity exposure?
| Passive Global ETFs |
NAV (INR) |
1M (%) |
3M (%) |
6M (%) |
1Y (%) |
3Y (%) |
| Mirae Asset Hang Seng TECH ETF |
21.2 |
2.5 |
9.9 |
-2.7 |
67.8 |
14.6 |
| Mirae Asset NYSE FANG+ ETF |
130.9 |
3.3 |
14.4 |
14.5 |
42.3 |
44.6 |
| Mirae Asset S&P 500 Top 50 ETF |
53.7 |
4.6 |
15.0 |
9.4 |
23.8 |
24.3 |
| Motilal Oswal Nasdaq 100 ETF |
200.8 |
3.2 |
13.3 |
9.8 |
25.7 |
24.7 |
| Motilal Oswal NASDAQ Q 50 ETF |
81.3 |
6.6 |
15.2 |
7.9 |
28.0 |
14.6 |
| Nippon India ETF Hang Seng BeES |
412.4 |
2.6 |
10.6 |
10.2 |
52.7 |
15.6 |
Source: ACE MF. Note: Priced as on 22 August, 2025.


 2024 HDFC TRU