The recent surge in multi-national companies (MNC) listing their Indian subsidiaries, primarily through an Offer for Sale (OFS), signals a strategic shift in how global parents are unlocking value from India. This is predominantly driven by India’s deepening domestic liquidity, regulatory support, and consistently higher valuation multiples compared to their global counterparts. MNCs are increasingly using the Indian markets to monetize mature, high- growth local operations. Landmark IPOs, such as Hyundai Motors and LG Electronics India, have shown strong institutional participation, even at rich valuations. Indian listed subsidiaries often trade at 2–4x the parent’s P/E despite being smaller in size, reflecting the “India premium” and investor confidence in long-term structural growth. While valuations demand selectivity, the expanding pipeline of MNC IPOs in the Indian equity market creates new high-quality opportunities for institutional portfolios and marks India’s evolution into a global capital market hub.
Executive Summary: India’s Rise as a Global IPO Hub
India’s IPO market entered a phase of renewed strength in CY2025, underpinned by a deep deal pipeline, favorable market liquidity, and rising issuer and investor confidence. According to LSEG data (here), over 240 large and mid-sized firms raised $10.5 billion in the first nine months of 2025, making India the third-largest globally in terms of funds raised via IPOs.
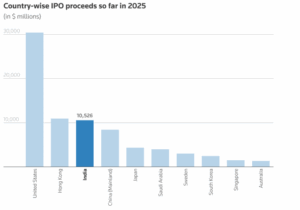
Source: LSEG, Reuters, HDFC TRU. Note: Data as of 30 Sep, 2025.
India’s equity market is set for a strong finish to the year, with Initial Public Offerings (IPOs) projected to raise up to $8 billion in 4QCY25. This surge is driven by firms looking to capitalize on a favourable market window following a relatively quiet first half. High-profile listings, including Tata Capital and LG Electronics India, have already concluded their share sales this month. The robust IPO pipeline for November and December reportedly includes major names like ICICI Prudential AMC, the ed-tech platform PhysicsWallah, AI services firm Fractal Analytics, and non-bank financial company Credila Financial. The market’s current resilience and strong momentum are fundamentally sustained by healthy appetite from both retail and institutional investors.
Despite a subdued broader market, India’s IPO performance has been remarkably resilient. In the first 9-months of CY2025, average listing gains have remained very strong at around 12%, as per Reuters, showcasing sustained investor appetite for new issuances. Out of 59 large IPOs, an impressive 42 debuted in the green, underscoring the robust demand and pricing power in the primary market. What makes this even more striking is that these gains have come despite the Indian equity benchmark indices (Nifty50/Nifty500), significantly lagging China and several other emerging market peers.
Looking ahead, with structural demand, improving sentiment, and a robust issuance pipeline, India is well positioned for a sustained IPO upcycle over the coming quarters, solidifying its status as one of the world’s most attractive equity fundraising destinations.
Why Global MNC businesses are considering listing in India?
- Domestic liquidity and depth: The surge in IPOs in India is fundamentally driven by the expanding domestic retail and institutional investor base, creating a deep pool of available capital. In 2024, two-thirds of the total IPO funding originated domestically, a sharp increase from only a quarter three years prior. A significant contributor to this domestic liquidity is the robust inflow of retail savings into mutual funds and market-linked investments via Systematic Investment Plans (SIPs). In CY25 YTD, SIP inflows hit a record average of approximately ₹27k crores per month. This consistent flow of capital has led to the emergence of domestic mutual funds as key players in both primary and secondary
- Material valuation arbitrage: The Indian public market is characterized by exceptionally strong IPO valuations, driven by investor conviction in scale-over-profitability models across key sectors (technology, healthcare, infrastructure). This is evidenced by the median 2024 Indian IPO P/E of 21.5x, a significant premium over the U.S. (14x) and European (12x) benchmarks, according to DLA Piper (here). For international companies and financial sponsors holding India- centric assets, a domestic IPO directly targets these superior market multiples, representing the most effective path to maximum value extraction compared to a global
- Exposure to high growth economy: India is set to be one of the world’s fastest-growing major economies, sustaining >6% annual growth over the next five years. This potent combination of rapid expansion and soaring consumption is creating an ideal environment for digital and consumption-led IPOs. The key catalyst is India’s digitally-native middle class, which is expected to constitute over 50% of the population by 2030. Furthermore, a decisive shift in household savings toward equity ensures robust market appetite for these new public offerings.
Our deep-dive note provides a detailed analysis of the current wave of MNC IPOs/OFS in India, examining recent and upcoming deals, their deal structures, valuation dynamics, historical performance, and investor sentiment.
A. Key MNC IPOs (2024–25) – Deal Snapshot and Outcome:
| Company |
Sector |
Offer Size & Type |
Stake Sold |
Valuation (P/E) |
Investor Response |
Listing Outcome |
| Hyundai Motor India |
Automobiles |
₹27,870 Cr IPO (100% OFS) |
17.5% |
~26x FY24 EPS at upper band |
QIB book ~7x (FII-heavy); Retail only 0.5x (valuations a concern) |
Listed Oct 2024; flat to mildly negative on debut. |
| LG Electronics |
Consumer Durables (Electronics) |
₹11,607 Cr IPO (100% OFS) |
15% |
~35x FY25 EPS at upper band |
Strong anchor demand (₹3,475 Cr from marquee FIIs/DIIs); IPO oversubscribed >54x |
Listed mid-Oct 2025 at a premium of 50% |
| Carraro India |
Auto Components |
₹1,250 Cr IPO (100% OFS) |
~31% |
~64x FY24 EPS at upper band |
Moderately subscribed (1.18x); niche investor interest (theme: agri machinery) |
Listed Dec 2024 at offer price; stable post-listing. |
Source: Media reports, company filings. P/E based on approximate trailing earnings at time of deal.
Timeline of Notable MNC Listing Events:
- 2016-2017: Wave of insurance IPOs (ICICI Prudential Life, HDFC Life, SBI Life) – foreign JV partners partially exit via OFS as sector regulator nudges public listing. All debut successfully, marking first major MNC stake monetization trend of the decade (financial sector).
- H2 2024: Hyundai Motor India’s IPO was launched on Oct-24 as India’s biggest ever; massive institutional turnout, tepid retail, listing on Oct 22, 2024. Around the same time, smaller MNCs like Carraro proceeded with IPO (Dec-24).
- Oct-2025: The $1.3 billion maiden share sale by LG Electronics’ India, became the most subscribed billion-dollar IPO in nearly two decades. The share sale drew bids worth $49.9 billion at the top end of its price band, making it the most-subscribed large Indian offering since Reliance Power’s IPO in
- H2 2025: A growing trend has emerged among global joint ventures in India, especially 50:50 or near-parity structures, where foreign partners are pushing for IPOs primarily as exit or stake-trimming Instead of raising fresh funds, these listings are largely OFS-driven, allowing global shareholders to monetize their holdings without diluting capital (e.g., Canara Robeco AMC, Canara HSBC Life, ICICI Prudential AMC, etc.). Across financial services and other sectors, these deals illustrate a clear shift: global JV partners are using Indian public markets to systematically exit or rebalance their 50:50 stakes, capturing high valuations and liquidity while leaving the companies’ capital structures untouched.
- Looking Ahead: The success of these offerings has spurred speculation about some of the other MNCs listing Indian For instance, Tenneco Clean Air, which makes catalytic converters, suspension and powertrain components, is the latest company to tap India’s capital market amid a resurgence in IPO activity for an initial public offering worth up to $350 million through an 100% OFS. Moreover, the US luxury watchmaker Fossil Group(here) is also reportedly exploring an Initial Public Offering (IPO) for its Indian subsidiary, aiming to raise between $300-400 million by selling a stake of as much as 25%. According to Bloomberg (here), Hindustan Coca-Cola Beverages (HCCB) – Coca-Cola’s India bottling arm, is reportedly exploring an IPO for a potential valuation of US$ 10 bn with the deal possibly raising US $1bn. 2026 and beyond could see Honda India and possibly other Japanese and European companies considering listings. The pipeline will depend on equity market conditions, if the valuations remain favourable and if the 2024–25 cohort of IPOs trade well.
Net-net, the pipeline of MNC IPOs features large, well-established Indian subsidiaries across sectors such as autos, consumer durables, industrials, financial services, where the foreign parents are seizing the moment to unlock value. The common thread is that these IPOs are predominantly sell-downs by the promoters (MNC parents) rather than capital-raising for the Indian company, reflecting a clear intent to capitalize on India’s equity market enthusiasm as an exit mechanism.
B. Deal Structures and Exit Trends:
A striking aspect of this IPO wave is the deal structure: most MNC listings in India are structured as Offer for Sale (OFS) by existing shareholders (the foreign parent), with little or no fresh equity issuance. This means the parent company is selling part of its stake to public investors, and the IPO proceeds go to the parent (exiting shareholder), not to the Indian operating company.
Key observations on this trend include:
- Pure OFS Listings: Both Hyundai Motor India and LG Electronics India IPOs were 100% OFS, with no new shares issued. Hyundai’s $3+ billion offer consisted entirely of shares sold by the Korean parent, which trimmed its holding by 17.5%. Likewise, LG’s ₹11,607 crore IPO involved the parent offloading ~15% of its stake. Similarly, Carraro and several others have followed the same template: IPO as an exit vehicle for the promoter. This approach contrasts with typical growth-company IPOs where fresh capital is raised; in MNC cases, the Indian subsidiaries are often self- sufficient or can be funded by the parent if needed, so raising local capital is secondary to providing liquidity for the parent’s
- Capital Recycling and Monetization: The OFS route allows the MNCs to recycle capital out of mature Indian businesses and redeploy it elsewhere (or return cash to shareholders). For instance, Whirlpool Corporation (USA) in Feb-24 sold a 25% stake in its Indian listed arm via block trades for ₹4,039 crore, reducing its holding from 75% to 51%. The CEO explicitly framed it as “asset arbitrage”, taking advantage of high Indian valuations to unlock cash, which Whirlpool used to optimize its capital Similarly, British American Tobacco (BAT), which long held a ~29% stake in ITC Ltd (India’s tobacco-to-hotels conglomerate), sold a 3.5% and 2.5% slice of ITC for ~$2 billion and $1.5 billion in 2024 and 2025, respectively, cashing in on ITC’s stock surge. These transactions underscore a trend: global parents are monetizing stakes in Indian subsidiaries at opportune market moments, either through IPOs or secondary market OFS, to capture value that might be underappreciated in their home markets.
- Regulatory Exit Requirements: In some cases, OFS transactions by MNCs have been driven by regulatory requirements. India’s rules mandate at least 25% public shareholding in listed companies. Many foreign parents historically held 75% or more in their Indian units, when SEBI enforced the 25% minimum public float, numerous MNCs (e.g. Gillette, Oracle Financial Services, Honeywell Automation, etc.) conducted OFS sales to trim promoter ownership to 75%. More recently, sector regulators have pushed for listings: the insurance regulator (IRDAI) encouraged insurers to list, prompting IPOs like ICICI Prudential Life (2016) and SBI Life (2017) where foreign JV partners (Prudential plc, BNP Paribas) used the IPOs to reduce stakes. Thus, the OFS exit has sometimes been a compliance move to meet Indian shareholding norms or listing obligations in regulated sectors.
- Legacy Listings vs. New Listings: It is worth distinguishing legacy listed subsidiaries from this new wave. Many MNCs (Unilever, Nestlé, Siemens, Colgate-Palmolive, ) have had their Indian arms listed for decades, those structures were not originally driven by today’s arbitrage considerations but by historical circumstance or company policy at the time. The current trend, by contrast, is proactive listing of previously unlisted subsidiaries purely as a financial strategy. One reason such listings were rare historically is the complexity of managing multiple public listings across jurisdictions; MNCs tended to prefer wholly-owned units for operational simplicity. However, as discussed, the scales have tipped now because the benefits (high valuations, liquidity) outweigh the costs. Now, with bullish markets, MNCs see more reason to list than to avoid listing, marking a shift in mindset.
C. Valuation Insights: Indian MNC Listed Subsidiaries vs. Global Parents
One of the most compelling aspects of these MNC listings is the valuation premium that Indian subsidiaries command relative to their global parent companies. Across sectors and geographies, a consistent pattern has emerged: Indian-listed arms of MNCs trade at significantly higher price-to-earnings (P/E) multiples than their parent’s stock. This valuation gap underscores investor optimism about India’s growth and, in some cases, a scarcity premium for certain businesses on Indian exchanges.
- High P/Es in India vs. Overseas: A recent analysis identified at least ten prominent MNC cases where the Indian subsidiary’s P/E far exceeds their respective global parent’s. For instance, Hindustan Unilever (HUL) trades near 54x earnings vs 23x for parent Unilever plc. Nestlé India boasts a P/E of ~71x, dwarfing Nestlé SA’s ~19x. In industrials, ABB India and Cummins India trade at P/E multiples of ~58x and 55x, respectively, compared to 32x and 19x for ABB Ltd and Cummins
The table below illustrates several such comparisons:
| MNC Group |
Indian Listed Subsidiary |
Current P/E (Parent) |
Current P/E (India) |
India Premium (x) |
| Unilever Plc |
Hindustan Unilever (HUL) |
23x |
54x |
2.3x |
| Nestlé SA |
Nestlé India |
19x |
71x |
3.7x |
| Suzuki Motor Corp |
Maruti Suzuki India |
10x |
35x |
3.5x |
| ABB Ltd |
ABB India |
32x |
58x |
1.8x |
| Cummins Inc |
Cummins India |
19x |
55x |
2.9x |
| Hyundai Motor |
Hyundai Motors India |
5x |
35x |
7.0x |
| Colgate |
Colgate-Palmolive India |
21x |
42x |
2.0x |
| Honeywell |
Honeywell Automation India |
21x |
61x |
2.9x |
| Abbott |
Abbott India |
20x |
45x |
2.3x |
| Timken |
Timken India |
17x |
49x |
2.9x |
Source: Bloomberg, HDFC TRU. Note: Priced as on 14 Oct 2025.
- Market Capitalization Gap: In some extraordinary cases, the Indian subsidiary’s market cap approaches or even exceeds the global parent’s. Maruti Suzuki India, riding on India’s automotive boom, enjoys a materially higher market capitalization than Suzuki Motor Corp (Japan), despite Suzuki’s global scale. Similarly, Hyundai India (South-Korean auto-component maker’s arm) has been noted to comprise ~70% of its parent’s market cap with just a fraction of the revenue. These examples underscore how richly local investors value the India franchise of MNCs, sometimes seeing it as the most valuable piece of the global
| MNC Group |
Global Parent |
India Listed Subsidiary |
India as % Global Parent |
| Current Mkt. Cap (USD bn) |
TTM Sales (USD bn) |
Current Mkt. Cap (USD bn) |
TTM Sales (USD bn) |
Mkt. Cap |
TTM Sales |
| Unilever Plc |
146.9 |
65.1 |
66.2 |
7.4 |
45% |
11% |
| Nestlé SA |
243.2 |
105.0 |
25.5 |
2.4 |
10% |
2% |
| Suzuki Motor Corp |
28.2 |
38.6 |
57.6 |
17.4 |
204% |
45% |
| ABB Ltd |
132.6 |
33.6 |
12.2 |
1.5 |
9% |
4% |
| Cummins Inc |
56.3 |
33.7 |
12.3 |
1.3 |
22% |
4% |
| Hyundai Motor |
31.7 |
130.2 |
22.1 |
7.9 |
70% |
6% |
| Colgate |
62.2 |
20.0 |
6.7 |
0.7 |
11% |
4% |
| Honeywell |
128.8 |
40.0 |
3.5 |
0.5 |
3% |
1% |
| Abbott |
228.7 |
43.1 |
7.2 |
0.8 |
3% |
2% |
| Timken |
5.0 |
4.5 |
2.5 |
0.4 |
50% |
9% |
Source: Bloomberg, HDFC TRU. Note: Priced as on 14 Oct 2025.
- Growth and Profitability Expectations: The justification for such rich valuations lies in India’s growth narrative.
Investors are pricing in higher growth trajectories for the India unit vis-à-vis the mature global operations. India’s economy has been growing faster than most developed markets, fuelling higher earnings growth for consumer goods, autos, and other sectors and investors pay up for that growth. Additionally, many Indian subsidiaries enjoy high return metrics and market dominance locally (e.g. Colgate India’s ~70% ROIC, Nestlé India’s market leadership in foods, etc.), which supports premium pricing. Better profitability or capital efficiency of the India arm in some cases also plays a role.
| MNC Group |
Global Parent |
India Listed Subsidiary |
| FY0 ROIC (%) |
FY1 EPS Growth (%) |
FY2 EPS Growth (%) |
FY0 ROIC (%) |
FY1 EPS Growth (%) |
FY2 EPS Growth (%) |
| Unilever Plc |
15.3% |
7.8% |
5.1% |
15.6% |
5.3% |
10.5% |
| Nestlé SA |
13.0% |
3.0% |
5.5% |
43.0% |
0.7% |
11.0% |
| Suzuki Motor Corp |
9.3% |
1.5% |
8.2% |
8.1% |
33.9% |
15.1% |
| ABB Ltd |
17.5% |
12.9% |
11.3% |
25.7% |
-11.2% |
16.7% |
| Cummins Inc |
11.0% |
4.5% |
12.1% |
19.4% |
9.1% |
14.5% |
| Hyundai Motor |
4.2% |
-13.1% |
1.0% |
36.9% |
2.3% |
20.2% |
| Colgate |
34.2% |
0.6% |
6.0% |
72.4% |
-4.9% |
9.8% |
| Honeywell |
12.7% |
8.6% |
7.7% |
10.9% |
8.4% |
9.0% |
| Abbott |
18.7% |
-24.2% |
10.3% |
29.6% |
13.3% |
13.2% |
| Timken |
9.0% |
2.4% |
15.2% |
15.2% |
1.2% |
24.4% |
Source: Bloomberg, Company Reports, HDFC TRU. Note: Priced as on 14 Oct 2025.
- Scarcity and Float Considerations: Another factor is the limited free float of these stocks. With many MNC promoters keeping around 75% ownership, only 25% shares are available to the public. This scarcity can drive up valuation multiples as institutional investors compete for a small pool of shares to get exposure to these high-quality For example, Honeywell Automation India or 3M India, small floats of strong multinational entities, have historically traded at exorbitant P/E multiples, partly due to low liquidity. This phenomenon means Indian MNC stocks can behave more like “quasi-private” equities with a captive shareholder base, deserving a valuation premium (though it raises the question of whether such premiums are sustainable).
The Nifty MNC Index comprises of 30 listed companies in which the foreign promoter shareholding is over 50%.It serves as a good proxy to track the performance and valuations of multinational companies (MNCs) listed in India. The MNC Index currently trades at a P/B of 8.6x (vs. the Nifty 50 at 3.4x), implying a premium of ~150%. Historically, the MNC Index has always traded at a significant premium to the broader index, reflecting a median premium of ~100% (in P/B terms).
This can be primarily attributed to MNC’s Quality factor premium:
- High Return on Equity (ROE)
- Strong Corporate Governance
- Healthy Balance Sheet (generally net cash).
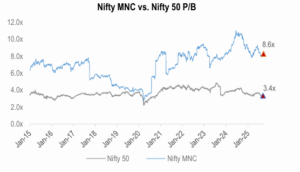
Source: Capitaline, NSE, HDFC TRU. Note: Priced as on 30 September, 2025.
D. Historical Return and Risk Profile:
- Cumulative Equity Curve: When considering historical performance, many listed MNC subsidiaries have delivered robust long-term returns, albeit with high valuations as a constant companion. Over the last decade, the Nifty MNC index has generally trended upwards, though it sometimes underperforms broader indices in bull markets (as it’s heavy in defensives like FMCGs).
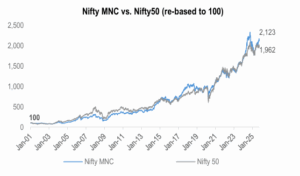
Source: Capitaline, HDFC TRU. DataPeriod: 1 Jan 2001 – 30 Sep 2025.
- Rolling Returns: We also tested the historical returns performance of these indices on a rolling returns basis – which we feel is a much better metric as it gives a more comprehensive overview by calculating performance over various periods and economic
We note that, even on rolling returns basis, the Nifty MNC Index has outperformed the Nifty50 Index.
- The Nifty MNC Index outperformed the Nifty50 in 53% of 3-year periods and 55% of 5-year periods since Jan-2001.
- The 3-yr and 5-yr rolling median returns of the Nifty MNC Index was at 14% and 15%, respectively, as compared to 13% and 12%, for the Nifty50, implying a premium of 100-300
| 3 Years Rolling Returns (5,410 Observations) |
Nifty MNC |
Nifty50 |
| Median Returns (%) |
14% |
13% |
| % times Rolling Avg. Returns > 15% |
44% |
37% |
| % times outperform Nifty50 |
53% |
| 5 Years Rolling Returns (4,913 Observations) |
Nifty MNC |
Nifty50 |
| Median Returns (%) |
15% |
12% |
| % times Rolling Avg. Returns > 15% |
50% |
34% |
| % times outperform Nifty50 |
55% |
Source: Capitaline, HDFC TRU. Data Period: 1 Jan 2001 – 30 Sep 2025.
- Maximum Drawdown: When comparing the maximum drawdowns of the Nifty MNC Index vs. Nifty50, an important structural difference emerges. The Nifty MNC Index, has shown shallower drawdowns compared to the broader Nifty50, reflecting stronger parent backing, higher governance standards, and steady cash flows. This relative outperformance in down markets comes from high-quality balance sheets, low leverage and strong pricing power. Overall, the drawdown profile of MNCs reinforces their role as a defensive compounder segment within equities, offering better capital protection in crises with faster mean reversion, making them attractive for long-term investors seeking stability without sacrificing growth.
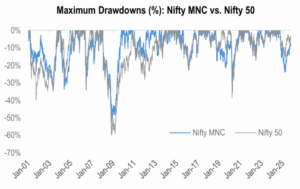
Source: Capitaline, HDFC TRU. DataPeriod: 1 Jan 2001 – 30 Sep 2025.
Our Take:
- Robust Domestic Capital Markets: India’s capital markets have matured significantly, with a large pool of domestic capital now available. Domestic mutual funds and retail investors provide two-thirds of IPO funding in 2024, a sea- change from a decade ago when foreign capital dominated. Steady monthly systematic investment plan (SIP) flows have created reliable liquidity. This depth means large IPOs can be absorbed. A strong equity culture domestically also reduces reliance on volatile FII flows, providing confidence to issuers that deals can sail through even if global sentiments
- High Valuations = Valuation Arbitrage: As detailed earlier, the valuation premium in India is a big pull. India offers valuation arbitrage opportunities. MNCs are aware that an Indian IPO can fetch them higher multiples than an IPO or sale elsewhere. This “India premium” is a key driver and therefore some MNCs consider it to unlock such value.
- Historical Success = Confidence: Investors take comfort from the fact that many long-listed MNC subsidiaries have been shareholder-friendly and wealth Companies like HUL, Nestlé, Siemens, and Colgate have a track record of prudent capital allocation, dividends, and professional management, often superior to local peers. This creates a halo effect: new MNC listings are often presumed to be of high quality (the “MNC premium” in valuation is partly a trust premium).
- Valuation Discipline vs. FOMO: However, investors are also treading a fine line on valuations. The Hyundai IPO revealed a split in sentiment – while institutional books were overflowing, retail investors applied for barely half of their quota, as the retail and some domestic HNIs felt the issue was “not priced attractively” for short-term gains. At 26x earnings (almost at par with the much larger Maruti), Hyundai’s upside seemed limited in the near term, especially with auto sales momentum slowing. This wariness indicates that not all investors will blindly chase MNC IPOs at any price. Thus, pricing strategy in future MNC IPOs will need to balance giving some room for upside to ensure all-round
- The wave of MNC IPOs in India presents attractive opportunities to invest in high-quality businesses riding India’s growth, but at valuations that require careful analysis and selectivity: If chosen well, adding exposure to MNC subsidiaries can enhance portfolio quality and yield solid returns, as history has shown with the likes of Nestlé India and Siemens India. But discipline is key, not every highly valued IPO will translate into immediate gains (some might be long gestation plays). The onus is on investors to separate genuine value from simply an “MNC halo”, and to monitor ongoing performance to ensure these companies continue justifying the faith the market has placed in


 2024 HDFC TRU