
No Economics Degree? No Problem. A Practical Guide to Forecast Inflation. Inflation forecasting doesn’t have to be a mystery. This note cuts through the complexity with a simple, yet powerful, DIY methodology for the everyday person. By tapping into the predictable seasonal patterns of historical CPI data, you’ll gain a valuable edge in understanding where the economy is headed and the forces impacting your personal finances. It’s not about perfect predictions; it’s about gaining control and making smarter decisions about your own money.
Imagine a standard shopping cart that’s filled with the same items every single month. This cart isn’t just for groceries; it contains everything from your favourite fruit to the cost of a haircut, the price you pay for your Netflix subscription, and even your medical bills. This is what economists call a “fixed basket of goods and services.”
The Consumer Price Index (CPI) is like the total bill for that shopping cart. It’s a single number that tells you the average price of all those items.
Inflation is simply the change in that total bill from one year to the next. The inflation rate you hear on the news—for example, “inflation is at 5%”—is the Year-over-Year (YoY) change. This means economists have compared the total bill for a specific month (say, August of this year) to the bill for the exact same items in August of last year. To summarize:
Essentially, inflation measures how much more (or less) money you need today to buy the same things you bought a year ago.
| CPI Component | Weight (%) |
| 1. Food and Beverages | 45.9 |
| · Cereals and products | 9.7 |
| · Milk and products | 6.6 |
| · Vegetables | 6.0 |
| · Prepared meals, snacks, sweets etc. | 5.6 |
| 2. Miscellaneous | 28.3 |
| · Transport and communication | 8.6 |
| · Health | 5.9 |
| · Education | 4.5 |
| · Personal care and effects | 3.9 |
| 3. Housing | 10.1 |
| 4. Fuel and Light | 6.8 |
| 5. Clothing and Footwear | 6.5 |
| 6. Pan, tobacco, and intoxicants | 2.4 |
| Total (1+2+3+4+5+6) | 100.0 |
Source: MoSPI, HDFC TRU
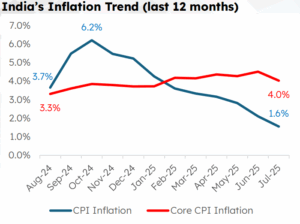
India’s CPI basket is dominated by food components with ~46% weight.
Core inflation is CPI inflation excluding food and fuel components which together have weight of ~53%
Economists use core inflation to measure persistent movement in prices, filtering shocks from volatile food and fuel components.
Source: MoSPI, HDFC TRU
CPI inflation in Jul 2025 at 1.6% was lowest in 8 years.
As can be seen in the chart, CPI inflation tends to be very volatile compared to core inflation due to volatile food and fuel prices.
Core inflation helps in understanding long-term demand driven price trends in the economy.
Inflation is a critical economic variable for multiple stakeholders, including economists, central banks, governments, policymakers, corporations, investors, and individuals. Hence, the need to forecast its direction is universal, yet the task remains one of the greatest challenges in economics. Even the world’s most brilliant minds at central banks and global financial institutions struggle to predict its path with precision, as it’s governed by a complex and often unpredictable interplay of global and local factors. Acknowledging this profound difficulty, we present a simple, actionable methodology for you to create a personal inflation forecast.
While a simple year-over-year (YoY) comparison offers a basic starting point, a more nuanced approach is needed to capture the rhythm of the economy. By analysing historical seasonal patterns, you can build a more refined forecast that moves beyond a single data point. This methodology taps into the predictable month-to-month (MoM) movements that define the “seasonal DNA” of inflation. Here are the steps to execute this powerful approach:
Let’s assume we have the following hypothetical MoM inflation data for January over the last five years.
| Year 1 | Year 2 | Year 3 | Year 4 | Year 5 |
| 1.6% | 0.9% | 0.6% | 0.5% | 0.2% |
Below table shows the actual 5-year average MoM change for next 12 months. For instance, the Aug’25 figure of 0.2% has been derived by taking the average % MoM change for August months of previous five years (2020-2024).
| Month | Seasonal Trend (% MoM) |
| Aug’25 | 0.2% |
| Sep’25 | 0.3% |
| Oct’25 | 1.1% |
| Nov’25 | 0.3% |
| Dec’25 | -0.5% |
| Jan’26 | -0.3% |
| Feb’26 | 0.1% |
| Mar’26 | 0.2% |
| Apr’26 | 0.7% |
| May’26 | 0.8% |
| Jun’26 | 0.8% |
| Jul’26 | 1.3% |
Source: MoSPI, HDFC TRU calculation
Using these values, annual inflation (% CPI YoY) forecast for next 3 months is shown below:
| Aug’25 | Sep’25 | Oct’25 |
| 1.8% | 1.4% | 1.2% |
Source: HDFC TRU calculation
To check the efficacy of our DIY inflation model, we tested it against historical CPI data. We forecasted CPI from January 2019 onward, using the seasonal trend calculated from the five preceding years (starting 2014). For each month, we applied this seasonal trend to the previous month’s index value. The inflation calculated using our method largely aligned with the actual CPI data, demonstrating the model’s effectiveness.
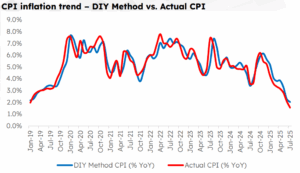
This DIY methodology, while simple, provides powerful directional insights that can align with the actual inflation trajectory. The fact remains that forecasting inflation precisely, both in terms of value and direction, is a complex task at which even experts can fail. This simple model has its limitations as it does not account for future economic shocks, changes in government policy, or unforeseen events that could significantly alter the price of goods. However, it provides a valuable tool for individuals to understand the underlying direction of inflation.


 2024 HDFC TRU