
Copper: The Next Leg of the Commodity Supercycle
Commodity cycles rotate and the baton is passing. Precious Metals rallied first with Gold delivering >60% and Silver >140% returns in 2025, meanwhile, Copper was also up 40% in 2025 but still trades at multi-decade lows vs. both Gold and Silver. That gap matters because Copper’s demand drivers, e.g., Power grids, AI, data centres, EVs, and Global electrification capex, are non-discretionary, while supply is constrained, with no major tier-1 Copper discoveries as well as declining Chilean copper output. Furthermore, with the DXY softening and inflationary pressures mounting, macro indicators suggest a potential structural re-rating for Copper.
Executive Summary:
There is a notable historical precedent for the inclusion of commodities in a diversified asset allocation mix. Relative to US equities, commodities are trading near 25-year lows on the S&P GSCI / S&P 500 ratio, a level that has historically coincided with shifts in relative asset class performance cycles over multi-year horizons. With US equity valuations stretched, higher-for longer inflation embedded, and de-dollarisation accelerating, commodities represent an asset class trading at lower relative levels.
Within commodities, supercycles do not move uniformly. The 2024-25 phase belonged decisively to precious metals – Gold rallied roughly >60% and Silver an extraordinary 148% in CY2025 alone. Market data indicates a potential rotation toward base metals, with Copper emerging as a key metric of this trend.
Copper consumption is closely linked with three long-term structural drivers: (i) global electrification, (ii) AI data-centre build-out, and (iii) the energy transition, running into a supply pipeline that has barely grown for a decade. The metal made fresh all-time highs at ~$14,800/t in 1QCY26 and currently trades around $13,500/t (see here).
Importantly, from a valuation standpoint, the Copper-to-Gold and Copper-to-Silver ratios are at or near multi-decade lows (Refer figure 9 & 10 in the note below). Historically, such extremes have preceded periods of meaningful copper outperformance versus precious metals.
For Indian investors, dedicated copper ETFs are not yet available domestically. Practical, regulated routes: MCX futures for the sophisticated and the Nifty Metal basket for equity allocators, and global copper ETFs via the LRS route for UHNI portfolios.
1. Why Commodities? Why Now?
Before discussing “Copper” specifically, an important structural question is how commodities behave as an asset class.
A. Commodities currently trade at the lower end of their historical valuation range relative to US Equities.
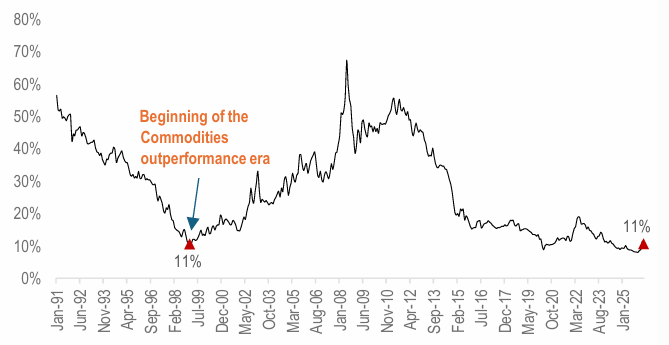
The S&P GSCI commodity index, measured against the S&P 500, has compressed to levels last seen in the late 1990s. The long-term median S&P GSCI to S&P 500 ratio is roughly 25%; today it sits closer to 11%. Historically, when this ratio has compressed to these levels, subsequent multi-year periods have frequently seen commodities outperforming equities on a relative basis, e.g., the 2000–08 Commodity supercycle, began from similar valuation floors. Historically, statistical mean reversion has been a factor observed in long-term asset ratios.
Figure – 1: Commodities (S&P GSCI) to US Equities (S&P 500) Ratio…
Source: Bloomberg, HDFC TRU. Note: Priced as of 30 April, 2026.
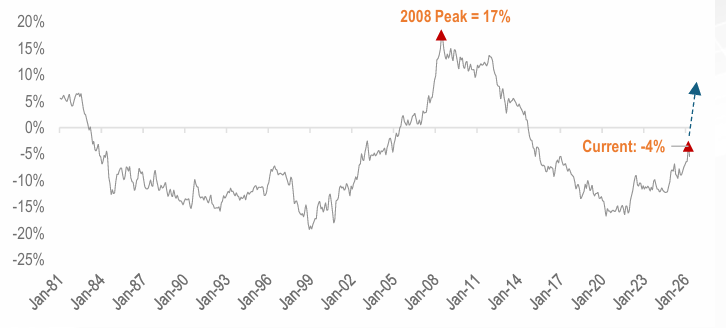
Figure – 2: Commodities (S&P GSCI) vs. US Equities (S&P 500) – 10-year Rolling Annualized Alpha (%)
Source: Bloomberg, HDFC TRU. Note: Priced as of 30 April, 2026.
B. The Macro Backdrop is supportive of “Hard Assets”.
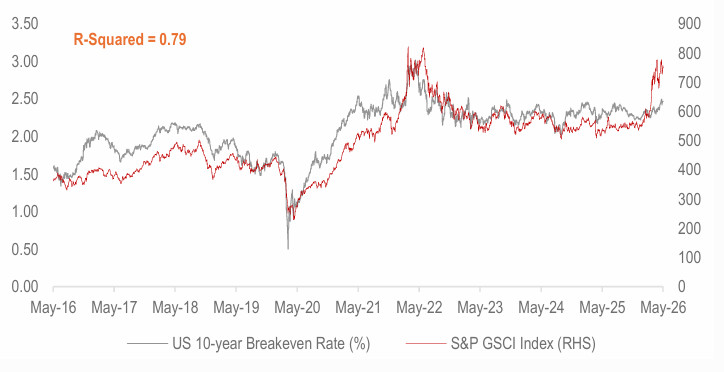
i) Higher-for-longer Inflation. Reshoring, defence spending and the energy transition, are all medium-term inflationary forces. Commodities have historically shown correlation with rising goods prices.
Figure – 3: The US 10-year Breakeven Inflation Rate and Commodities exhibit a very strong correlation…indicating higher inflation expectations in the near to medium-term…
Source: FRED, HDFC TRU.
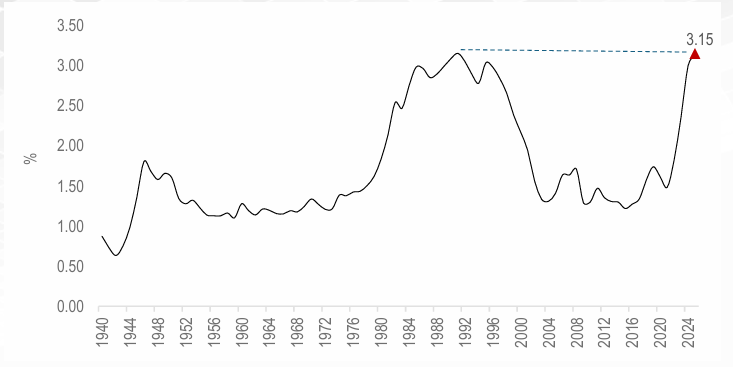
ii) Fiscal dominance and currency debasement. US federal debt now exceeds 120% of GDP and interest costs are the single fastest-growing line item in the budget. Central banks globally have responded by adding Gold at a record pace. In environments characterized by high fiscal outlays, market participants often evaluate hard assets as long-term allocations rather than short-term tactical positions.
Figure – 4: US Federal Outlays: Interest as % of Gross Domestic Product (GDP) at multi-decade highs…
Source: FRED, HDFC TRU.
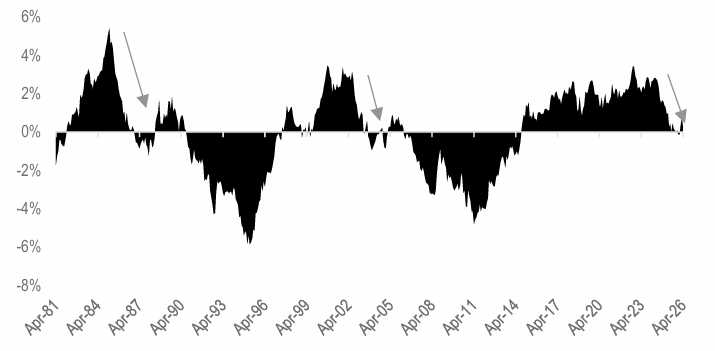
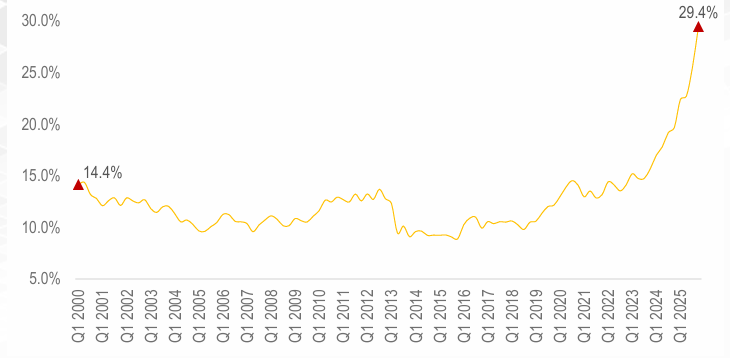
iii) De-dollarization theme accelerating. A weak DXY is mechanically positive for USD-denominated commodities and has historically removed a major headwind from metals. Moreover, central banks, especially in emerging markets, are shifting reserves away from US Treasuries into Gold.
Figure – 5: The DXY Index (10-year Rolling Returns %)
Source: Bloomberg, Tavi Costa, HDFC TRU.
Figure – 6: Share of Gold in the Total FX Reserves inching up…primarily driven by EM Central Banks (e.g. China)…
Source: Bloomberg, HDFC TRU. Note: Priced as of 30 April, 2026.
C. A decade of under-investment has set up the Supply side
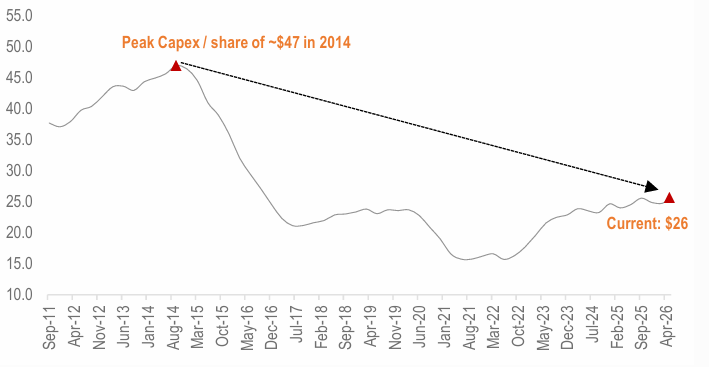
The commodity bear market of 2011–2020 was brutal for producers. Mining capex collapsed by more than 40% from its peak, Oil & Gas E&P spending stagnated, and ESG pressures further restricted new project development across the resource complex. Discoveries of new tier-1 copper, oil and gas deposits have effectively flatlined since 2015.
Demand, meanwhile, has accelerated, such as, electrification, AI, defence & emerging-market urbanisation are all commodity-intensive. From an economic perspective, structural supply constraints coupled with rigid demand dynamics typically exert upward pressure on baseline market clearing prices. Current conditions are consistent with those observed at the onset of previous multi-year commodity cycles.
Figure – 7: MSCI ACWI Global Metals & Mining Index: TTM Capex/share down ~45% from the 2014 peak…
Source: Bloomberg, HDFC TRU.
2. Where are we in the Commodity Cycle?
Long-cycle commodity bull markets: the 1970s, the 2002–08 BRICs cycle, and the post-2020 hard-asset reset share a remarkably consistent internal rhythm. They rarely move as one. Capital rotates from the metals most sensitive to monetary debasement (gold first, then silver) into those most sensitive to real-economy demand (industrial and base metals), and finally into agri commodities and energy.
The current cycle has followed that template almost to the letter:
- Phase 1 (2024-2025); Precious metals lead. Gold re-rated as central banks accumulated record tonnage and the US fiscal trajectory deteriorated. By end-2025, gold was up ~66% for the year and silver had compounded ~142%, breaching $100/oz in early 2026.
- Phase 2 (now unfolding); Base metals take the baton. Copper and Aluminium have begun to rerate, but is still in the early innings. The thesis is no longer purely cyclical, it is structural, driven by physical demand from electrification, grid upgrades, AI infrastructure, and EVs.
- Phase 3 (12–24 months out); Broadening to Agri and Energy. If history rhymes, agri-commodities will follow.
Figure – 8: Performance Scorecard
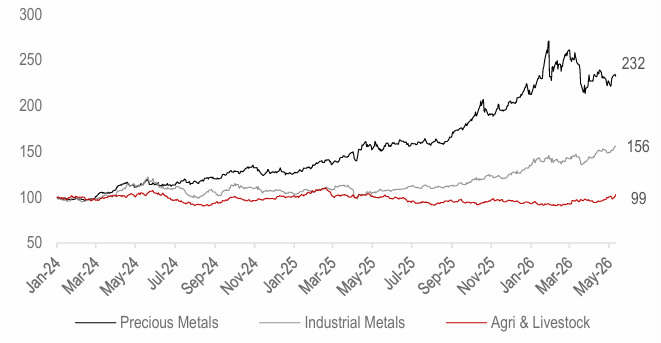
Source: Bloomberg, HDFC TRU. Note: We have used the S&P GSCI Indices as proxy for Precious Metals, Base Metals and Agri.
The chart makes the rotation case visually. Precious Metals have more than doubled predominantly driven by Silver, but Industrial Metals (led by Copper) are up only ~55% over the same window.
Table – 1: In price performance terms, “Copper” has barely started…
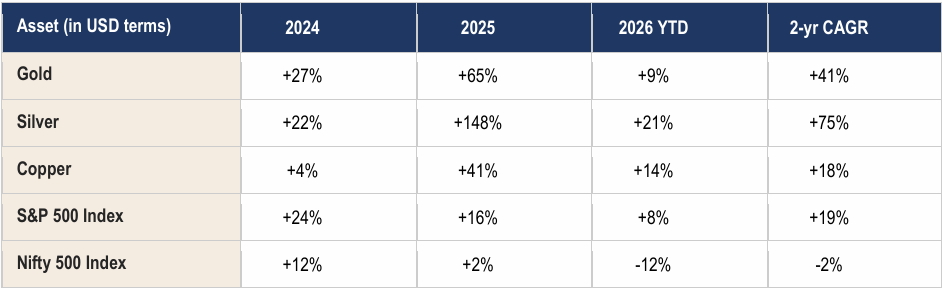
Source: Bloomberg, HDFC TRU. Note: Priced as of 12 May, 2026.
3. The Valuation Signal
Ratio analysis between commodities is one of the cleanest ways to identify late-cycle exhaustion in leaders and early-cycle opportunity in laggards. Two ratios are particularly important right now.
A. The Copper-to-Gold ratio; has been falling within a well-defined descending channel since 2011 and is now testing the lower boundary. In 25 years of data, readings below roughly 0.15% have been followed by significantly stronger forward returns for copper.
Figure – 9: Copper-to-Gold ratio at multi-decade lows…
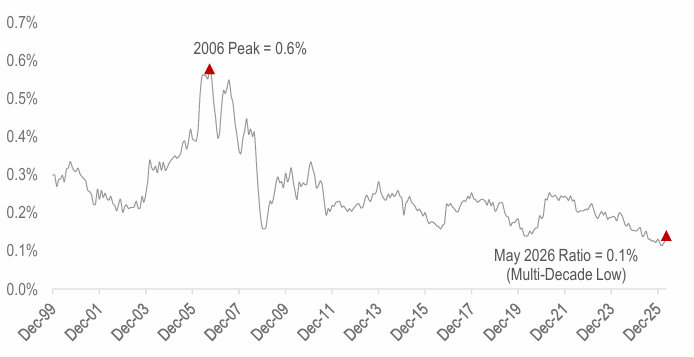
Source: Bloomberg, HDFC TRU. Note: Priced as of 12 May, 2026.
B. The Copper-to-Silver ratio. Silver is roughly 50% an industrial metal, so the Copper-to-Silver ratio strips out some of the safe-haven distortion that affects Gold. Even on this metric, Copper has been left behind.
Figure – 10: Copper-to-Silver ratio also at multi-decade lows…
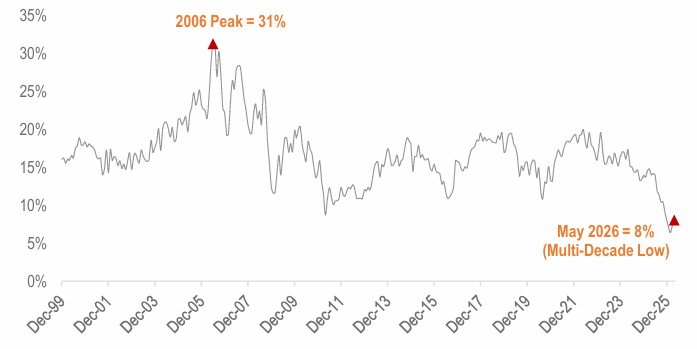
Source: Bloomberg, HDFC TRU. Note: Priced as of 12 May, 2026.
Historically, such extremes tend to mean-revert. This can statistically occur via a correction in precious metals, a catch-up in copper, or a combination of both based on evolving supply-demand dynamics.
4. Copper: Structural Demand–Supply Dynamics
A. Copper New Discoveries at Record Lows. The mining sector is navigating a structural shift in production pipelines, as new copper discoveries have declined, failing to offset the natural depletion of existing aging assets.
Figure – 11: Copper – New Discoveries
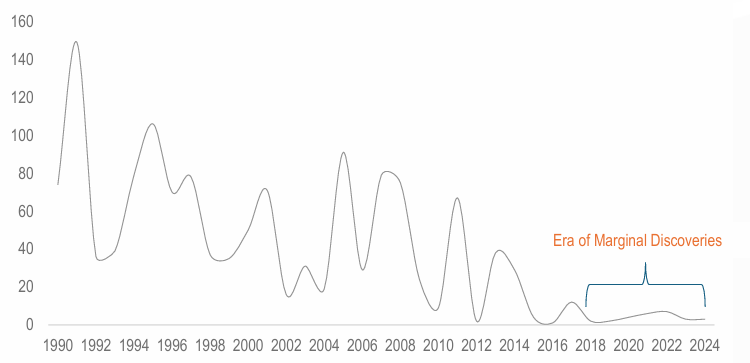
Source: S&P Global, Tavi Costa, HDFC TRU. Note: Discovery = The deposit must contain at least 500k MT of Copper.
B. Chile Production. Chile’s shifting Copper output metrics have influenced global supply calculations. As the world’s top producer, operational setbacks, compounded by water scarcity and a lack of new high-grade discoveries, have tightened the market for Copper concentrates. This supply framework remains a key variable as global supply chains adjust to offset changes in Chilean production volumes amidst rising demand for energy transition metals.
Figure – 12: Chile – Copper Monthly Production (in ‘000 tons)
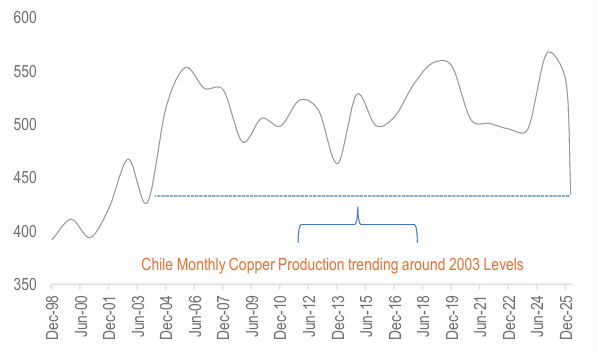
Source: Bloomberg, HDFC TRU.
C. Energy Security and Electrification. The ongoing Middle East conflict is driving up energy costs, forcing vulnerable nations to quickly switch to local renewable energy and upgrade their power grids. This massive expansion of electrical infrastructure is highly positive for Copper, as the metal is essential for the wiring and components needed to connect new power systems. To protect its own infrastructure, the U.S. has declared its power grid a national security priority, using the Defense Production Act (DPA) to secure it.
Figure – 13: Annual Grid Investments Forecasted to Grow
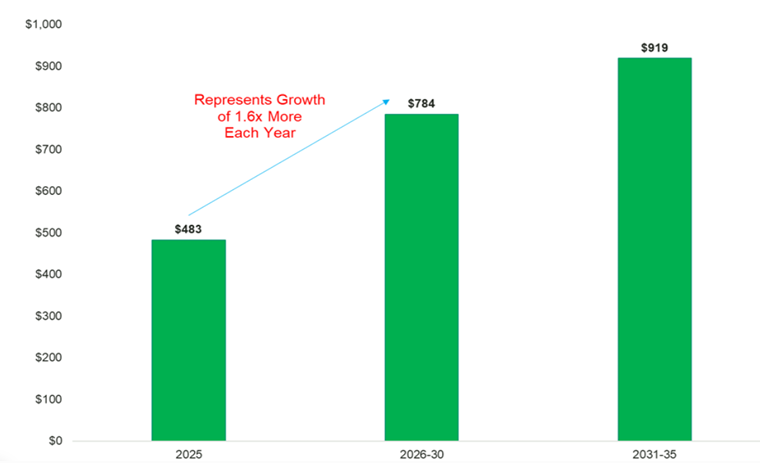
Source: BNEF Energy Transitions Trends 2026. NZE Forecast, Sprott, HDFC TRU.
D. Shift towards less price-sensitive end uses. The landscape of Copper demand is undergoing a fundamental shift, moving away from price-sensitive cyclical industries toward strategic, priority-driven sectors. Over the next two decades, projections suggest that growth could be driven primarily by defense, AI and data centers, and the energy transition segments, which have historically shown less sensitivity to traditional economic fluctuations.
Figure – 14: By 2040, high-growth strategic categories (AI, Defense, etc.) are projected to represent 45% of total demand, up from 32% in 2024, effectively decoupling a significant portion of the copper market from broader economic volatility
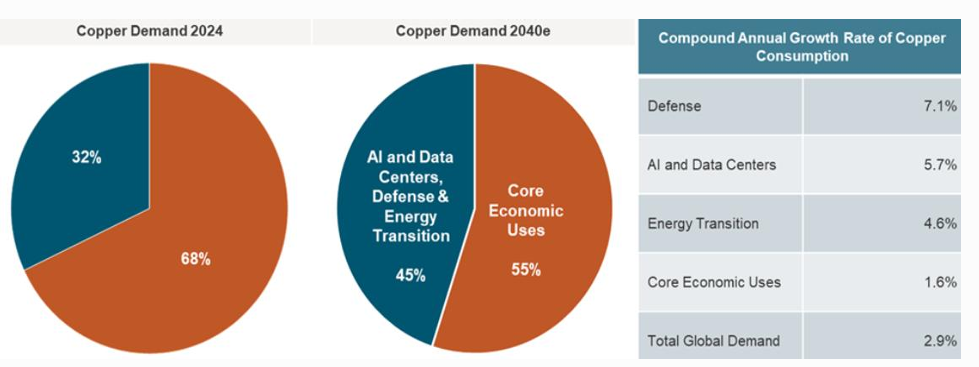
Source: S&P Global, January 2026. 2040e refers to estimated demand forecasts.
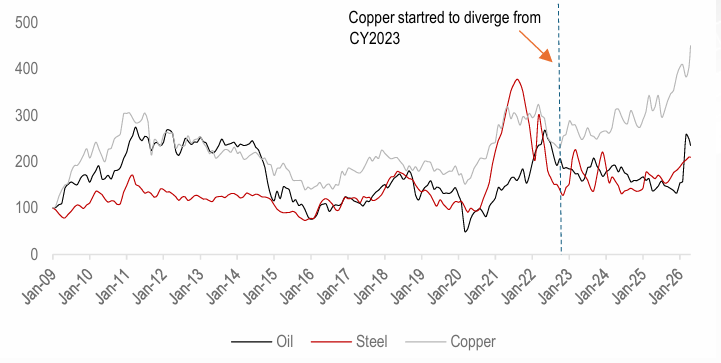
E. Gradual Decline in Correlation with Economic Cycle Commodities (like Oil & Steel). Copper is increasingly decoupling from traditional economic indicators like Oil / Steel, marking a significant shift in its market behavior. While these commodities once moved in tandem due to their shared reliance on the global business cycle, Copper is now being propelled by unique structural drivers, specifically the energy transition and high-tech infrastructure.
Figure – 15: Copper has decoupled from other Important Business Cycle Commodities like Oil and Steel…
Source: Bloomberg, HDFC TRU.
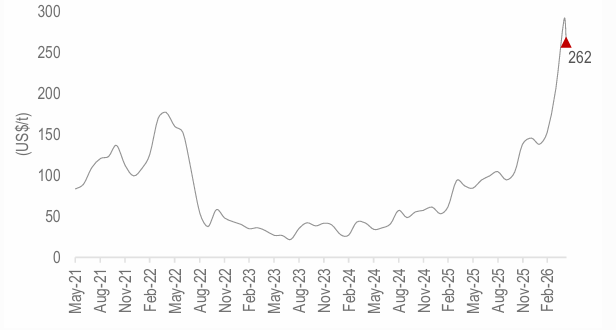
F. Sulfuric Acid Price Shock. The sharp spike in sulfuric acid prices is creating a supply-side bottleneck that places significant upward pressure on Copper prices. It is a critical input required to extract Copper and accounts for roughly 20% of Global Copper production, and the surging cost of acid has dramatically increased the break-even points for miners, particularly in Chile and Africa. This logistical constraint influences the marginal cost of production, shifting the baseline cost curves for global mine operations.
Figure – 16: Sulfuric Acid Price (USD/MT) is up ~80% on a YTD basis and >200% YoY
Source: Bloomberg, HDFC TRU.
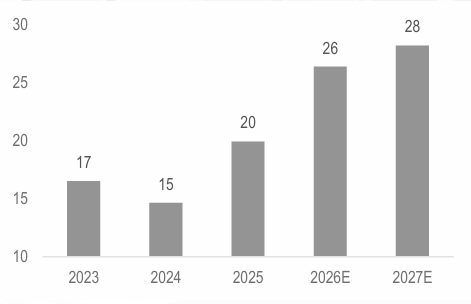
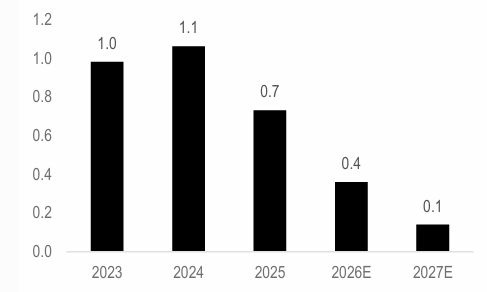
G. Copper Miner’s Healthy Profitability and Strong Balance Sheet. According to Sprott AMC (see here), at the current spot price of ~$13-14k per metric ton, 99% of the world’s copper mines are operating below their AISC, meaning virtually every mine is profitable, with the median copper mine carrying an AISC margin of ~55%. Infact, 9 out of 10 copper mines have operated profitably every year since 2020, a span that encompasses multiple commodity cycles and macro shocks.
Figure – 17: STOXX Global Copper Miners Index: ROE (%)
Source: Bloomberg, HDFC TRU.
Figure – 18: STOXX Global Copper Miners Index: Net Leverage (x)
Source: Bloomberg, HDFC TRU.
5. Key Risks to the Thesis
Copper is a cyclical commodity, and an evaluation of its structural drivers must be balanced against potential near-term risks, which include:
- Sustained US-Iran Conflict. According to J.P. Morgan, every 10% increase in Oil prices due to a supply shock could dampen global GDP by 0.16%. The beta of copper demand to global GDP is estimated at 1.2, meaning that if global GDP falls by 1%, copper demand growth could fall by 1.2% as a result.
- US recession risk. A meaningful US slowdown would compress base-metal demand even with AI/grid tailwinds intact.
- Near-term surplus possible. According to International Copper Study Group (ICSG), the refined copper market is expected to show a surplus of 96k tonnes in 2026, due to weaker demand and higher secondary output. A larger surplus of 377k tonnes is forecast for 2027 on additional supply.
- Substitution at extreme prices. Sustained prices above $14,000-$15,000/tonne incentivise substitution.
- China demand wobble. China is ~60% of global copper demand. Any weakness in demand relating to transport, construction, power and appliances will be net negative.
6. Our Take
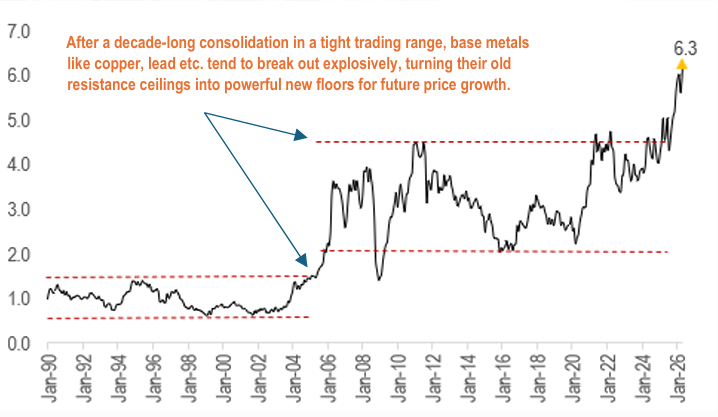
Analysis of structural factors suggests copper is experiencing market dynamics different from typical historical cycles, supported by (1) a stretched copper-to-gold ratio at multi-decade lows, (2) demand engines (grid, AI, EVs) that are non-discretionary, and (3) a supply pipeline that cannot respond inside 5–7 years, presents a combination of structural variables frequently analyzed together within global commodity markets.
Figure – 19: Copper Price ($/lb)
Source: Bloomberg, HDFC TRU.






 2026 HDFC TRU