
Indian equities structurally rewards “quality” and the evidence is very hard to ignore. The reasons are distinctly Indian; (i) promoter-dominated ownership, (ii) corporate governance dispersion and (iii) wide earnings variability mean that disciplined selectivity carries a durable edge. Quality portfolios, which are, screened on ROE, low debt/leverage and earnings stability, have consistently delivered superior returns with shallower drawdowns. In a market where growth is abundant, but earnings integrity is scarce, quality is not a style preference, it is a structural advantage.
Executive Summary: What is Quality Factor?
Factor investing identifies persistent, pervasive characteristics of securities that explain differential returns across stocks over time. Quality is one of the most academically well-grounded of these factors. Unlike momentum (which is purely price-driven) or value (which focuses on cheap multiples), “quality” targets companies with demonstrably superior business fundamentals.
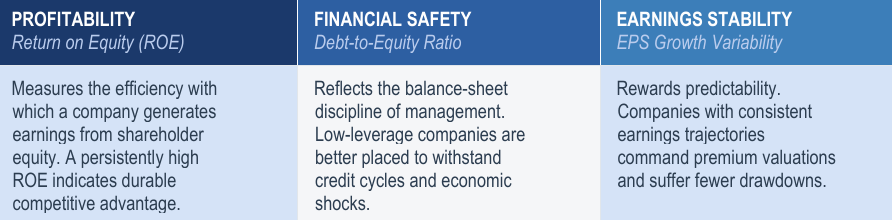
One of the most officially accepted academic framework, articulated by Asness, Frazzini and Pedersen, defines a quality company as one that is Safe, Profitable, Growing and Well Managed (here). The MSCI / NSE Quality Index framework, operationalises this through three core descriptors:
The NSE applies this framework across its family of Quality strategy indices, including the Nifty100 Quality 30, Nifty200 Quality 30, and Nifty500 Quality 50. The Nifty100 Quality 30 selects the top-30 quality companies from the Nifty100 universe; the Nifty200 Quality 30 draws from a broader mid-to-large-cap pool; and the Nifty500 Quality 50 extends coverage across the full large, mid-cap and small-cap spectrum.
Methodology
The Quality factor in India, has delivered a compelling and durable return premium in Indian equity markets. With factor-based investing gaining rapid traction in India through mutual funds and ETFs, the “Quality” style offers investors a transparent, rules-based path to superior risk-adjusted returns with lower drawdown and portfolio churn.
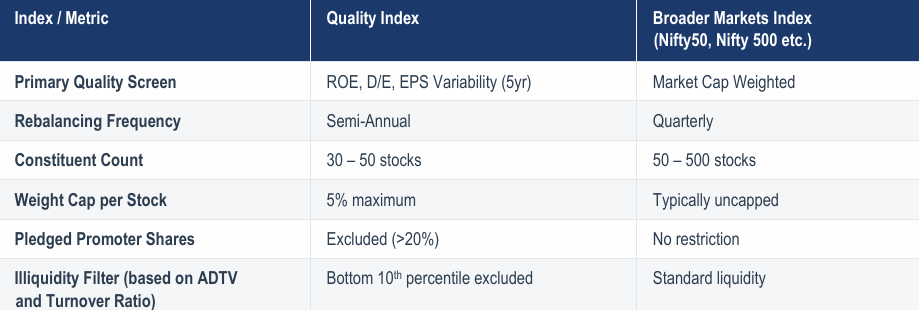
Table – 1: NSE Quality Index Construction & Methodology
“Quality Factor” Performance Overview: Global Markets and India
Globally, MSCI’s analysis confirms that quality indexes have outperformed their parent benchmarks by around 100-300 basis points since 1994, with lower drawdowns and higher sharpe ratio. During periods of elevated market volatility, “Quality” tends to outperform, underscoring its defensive character.
Table – 2: MSCI Quality Strategy Performance (in USD, since 30 June, 1994)
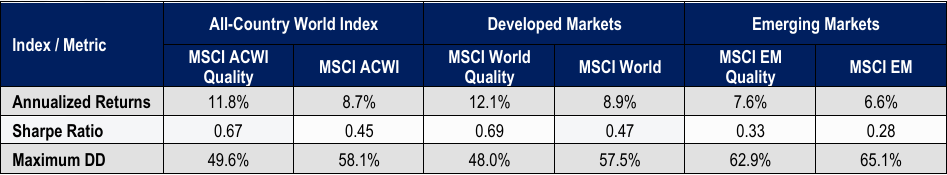
Source: MSCI, HDFC TRU. Priced as on 27 Feb, 2026.
We note that these dynamics also translate directly to the Indian setting (refer Figure 1 below).
Figure – 1: NSE Quality Strategy (Nifty500 Quality 50) Cumulative Curve (re-based to 100, since 1 April, 2005)
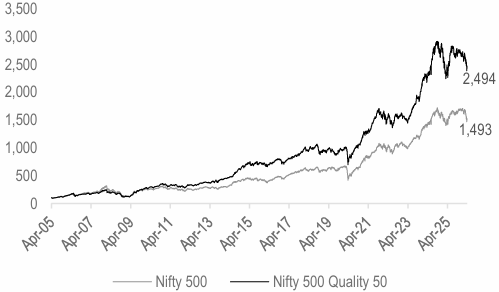
Source: NSE, HDFC TRU. Data Period: 1 April, 2005 to 27 March, 2026.
On a rolling return basis, Quality portfolios consistently outperformed the market for longer investment horizons. Rolling returns analysis was conducted to eliminate recency bias in performance. Figures in Table 3 below shows number of instances of outperformance of “Quality factor” with respect to the NIFTY 500 index.
Table- 3: NSE Quality Strategy Rolling Returns Performance (April’ 05 – March’26)
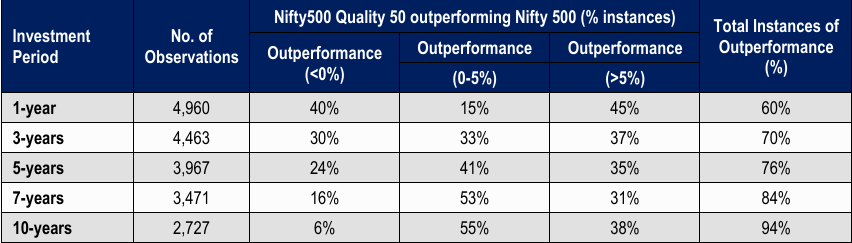
Source: NSE, HDFC TRU. Data Period: 1 April, 2005 to 27 March, 2026.
A drawdown is the peak-to-trough decline during a specific period of an investment. Our analysis suggests that “ Quality” portfolios record lower drawdowns compared to the broader market (e.g. Nifty500), resulting in relatively better performance during periods of market correction.
Figure – 2: NSE Quality Strategy (Nifty500 Quality 50) Drawdowns materially lower vs. the broader market (Nifty 500)
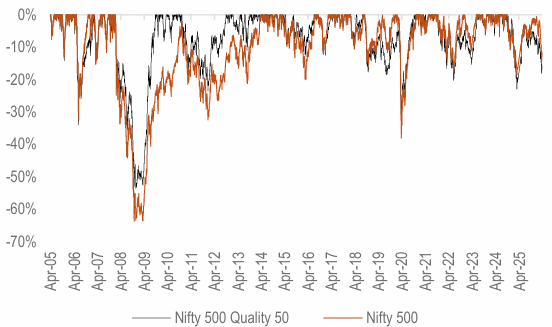
Source: NSE, HDFC TRU. Data Period: 1 April, 2005 to 27 March, 2026.
How does the “Quality Style” perform across Market Capitalizations in India?
While the preceding charts and tables clearly demonstrate that the “Quality” factor tends to outperform the broader diversified market (e.g. Nifty 500) over longer horizons, both on a cumulative and rolling basis. We note that, Quality also outperforms across various market capitalizations (i.e. large, mid & small-caps), in the longer-term.
Figure – 3: NSE Large-Cap Quality Strategy Performance (re-based to 100, since 1 October, 2009)
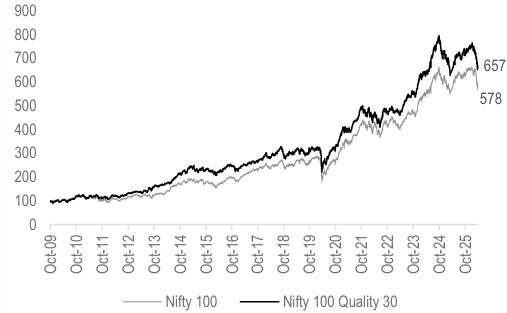
Source: NSE, HDFC TRU. Data Period: 1 October, 2009 to 27 March, 2026.
Figure – 4: NSE Mid-Cap Quality Strategy Performance (re-based to 100, since 1 April, 2005)
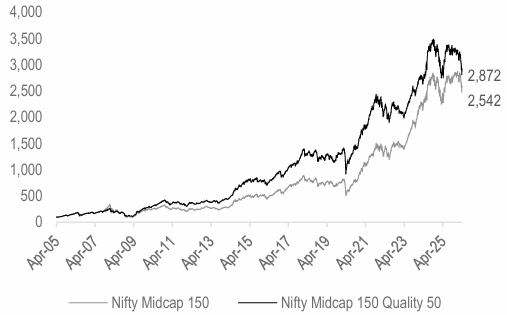
Source: NSE, HDFC TRU. Data Period: 1 April, 2005 to 27 March, 2026
Figure – 5: NSE Small-Cap Quality Strategy Performance (re-based to 100, since 1 April, 2005)
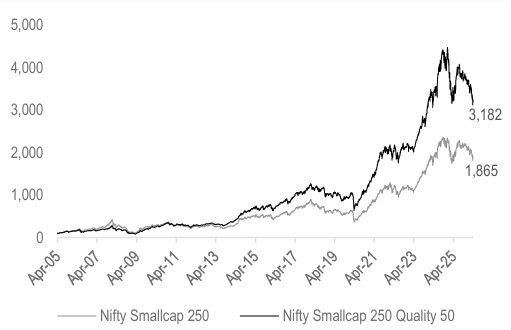
Source: NSE, HDFC TRU. Data Period: 1 April, 2005 to 27 March, 2026.
Assessing the performance of “Quality Factor” across Market Regimes / Cycles (since 2005)
We now examine how the “Quality” factor impacts returns throughout a specific market cycle. For this analysis, we evaluated the period from April 2005 to March 2026, dividing the timeframe into four distinct market cycles. Each cycle was further categorized into bull and bear phases, resulting in a total of four bull and four bear phases. Notably, as the bear phase of the fourth cycle is currently ongoing, our data for this final period concludes on March 27, 2026. Our analysis was conducted on the Nifty500 Quality50 Index vs. the Nifty 500 Index.
Figure – 6: Market Cycle 1 (CAGR Return %, Apr’05 – Dec’11)
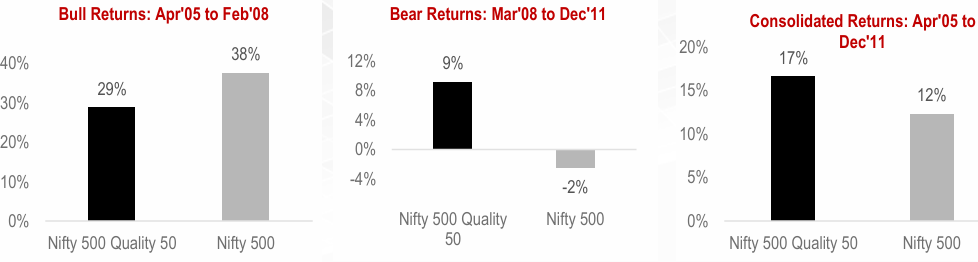
Source: NSE, HDFC TRU.
Figure – 7: Market Cycle 2 (CAGR Return %, Aug’13 – Mar’16)
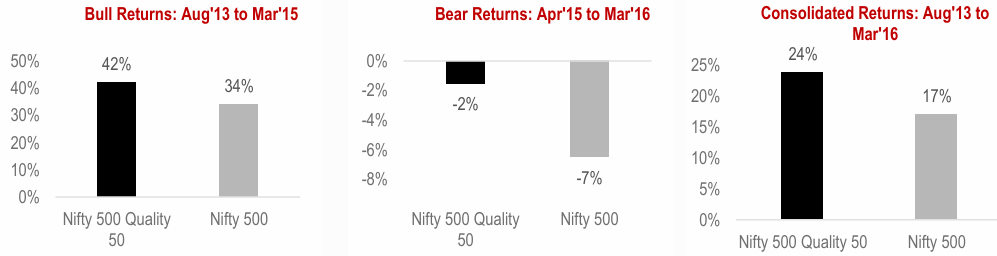
Source: NSE, HDFC TRU.
Figure – 8: Market Cycle 3 (CAGR Return %, Dec’16 – Mar’20)
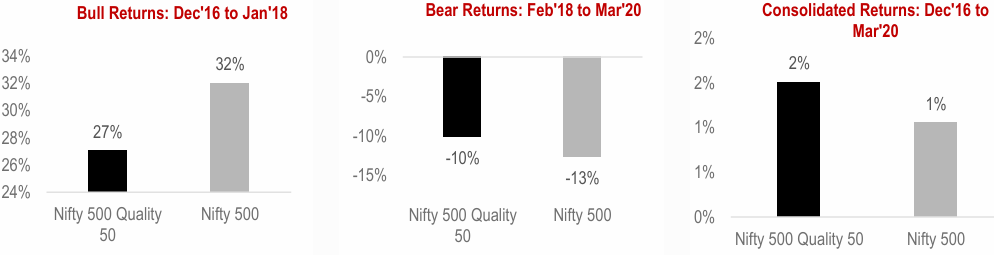
Source: NSE, HDFC TRU.
Figure – 9: Market Cycle 4 (CAGR Return %, Apr’20 – Mar’26)
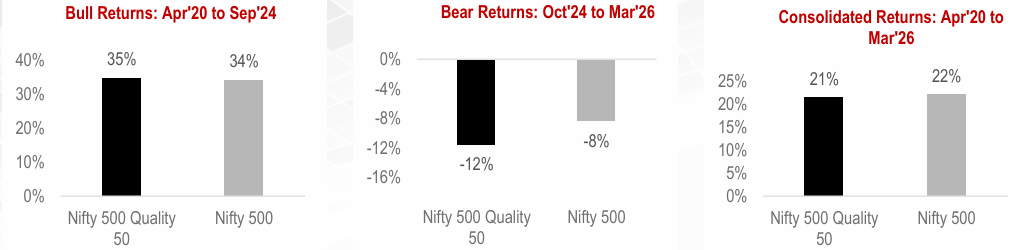
Source: NSE, HDFC TRU
Key Results / Takeaways:
Risks and Considerations
While the Quality factor has delivered structural outperformance, investors should be aware of the following:
Our View
We view the current environment, characterised by heightened global uncertainty as a particularly constructive entry point for Quality-oriented India equity allocations. The factor’s inherent defensiveness, combined with India’s structural long-term growth story, creates a compelling combination of resilience and participation.
We recommend that investors consider Quality factor exposure both as a standalone smart-beta allocation and as a lens for stock selection. Stocks with demonstrated quality discipline, measurable through high ROE, low leverage, and earnings stability, have historically delivered superior downside protection while capturing an adequate share of market upside.
The Quality factor is one of India’s most robust and academically validated return premia. A well-implemented quality tilt provides superior risk-adjusted returns, lower drawdowns and a natural corporate governance screen. With an expanding universe of passive and active vehicles now available, Quality deserves a strategic allocation in most long-horizon Indian equity portfolios.
Figure – 10: Since April-2020 (post COVID-19 era), Value style has led the Indian equity market followed by Momentum, while Quality has materially lagged, but we now anticipate a shift toward mean-reversion…
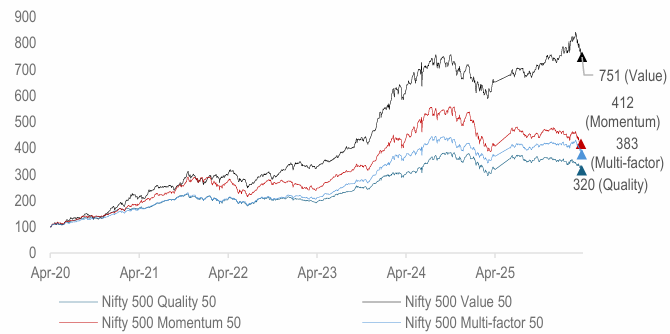
Source: NSE, HDFC TRU. Data Period: 1 April, 2005 to 27 March, 2026.
Figure – 11: …Quality and Value historically have exhibited an inverse relationship, with Quality-to-Value Ratio now at a multi-year low… further strengthening the case for Quality
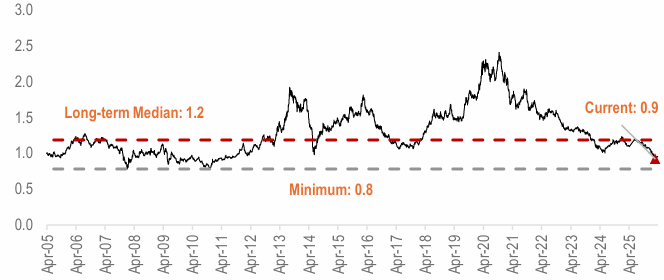
Source: NSE, HDFC TRU. Data Period: 1 April, 2005 to 27 March, 2026.


 2024 HDFC TRU