The USA is undergoing one of its most significant industrial shift in four decades, driven by tariffs, geopolitics, and a bipartisan push to rebuild domestic manufacturing capacity. Tech sector, which today accounts for ~45% of the S&P 500, is likely to face a slow but structural compression as capital rotates towards real asset sectors that are historically underweighted but central to the new American industrial order. For investors, this is not a short-term trade. It is a decade-long re-positioning away from the digital economy’s dominance and toward the hard assets that a reshoring America will need to build, power, and run itself.
America’s Industrial Rebirth: The Quiet Rotation Reshaping S&P 500
PART I — WHAT WAS THE RUST BELT ERA?
The term ‘Rust Belt’ was not always used in a negative sense. From the late 19th century through the mid-20th, the industrial corridor spanning Ohio, Pennsylvania, Michigan, Indiana, etc. was the beating heart of American economic power. It was called the Steel Belt, the Factory Belt and for good reason. This was the region that built America’s automobiles and forged its warships. It refined its oil and smelted its steel. Cities like Pittsburgh, Detroit, Cleveland, and Gary were not peripheral, they were the engine room of the world’s most dynamic economy. At its peak, manufacturing accounted for nearly 25-30% of US GDP, the US produced ~40 % of the world’s manufactured goods and millions of workers without college degrees could earn middle-class wages on the factory floor.
PART II — THE LONG DE-INDUSTRIALIZATION (1980–2025)
The decline was not sudden. It was the cumulative consequence of several decades of decisions made by politicians, economists, and corporate boards who believed, with genuine conviction, that globalization was a rising tide that would lift all boats.
A. Trade Liberalization & the China Shock
The pivotal moment was China’s entry into the World Trade Organisation in 2001. What followed was described by economists as the ‘China Shock’, a rapid displacement of American manufacturing by Chinese imports that was far more severe and permanent than mainstream trade models had predicted. Between 2000 and 2010, the US lost approximately 5.5 to 5.7 million manufacturing jobs. Entire industries, such as, textiles, electronics, furniture, steel, effectively ceased to exist at scale in America.
B. The Rise of the Knowledge Economy Consensus
The policy response was not to rebuild manufacturing, but to pivot away from it. The intellectual consensus of the 1990s and 2000s held that the future belonged to services, technology, and finance. America would design the products; the world would build them. This logic worked spectacularly well for shareholders, for coastal cities, and for the college-educated. It was catastrophic for the Rust Belt.
C. The Human Cost and the Political Consequence
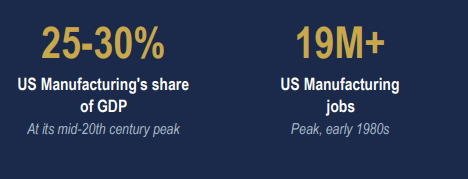
The economic data captures the scale but not the texture of what happened. Between 1979 and 2025, US manufacturing employment fell from a peak of ~19.5 million to 12.6 million, a loss of nearly one-third of the industrial workforce. Rust Belt cities that had no comparable industry to fall back on and saw generational poverty, opioid epidemics, and population collapse. Detroit lost more than half its population. Gary, Indiana, saw unemployment rates exceed 10% for decades.
Figure – 1: US Manufacturing Employment
Source: U.S. Bureau of Labor Statistics, HDFC TRU.
The political consequences were equally dramatic. Rust Belt states, such as, Ohio, Pennsylvania, Michigan, Wisconsin became the decisive swing states in American presidential elections. Their voters’ deep frustration with the globalization consensus is what put Donald Trump in the White House again in 2024.
PART III — WHY WE BELIEVE THE RENAISSANCE IS REAL
![]()
Force 1: Policy
▶CHIPS & Science Act. Over $52 billion committed to domestic semiconductor manufacturing. TSMC alone has pledged $100B+ across three new Arizona fabs; the largest foreign direct investment in US history.
▶Inflation Reduction Act. Sweeping tax credits tied to domestic content requirements for clean energy and EV manufacturing, forcing supply chains to localise.
▶The Tariff Wall. Under Trump’s second term, the average effective US tariff rate surged from less than 5% to around 20%; the highest in over a century. Steel, Semi-conductors, Autos – every pillar of the old Rust Belt is now shielded by targeted trade policy.
Figure – 2: US average tariff rate
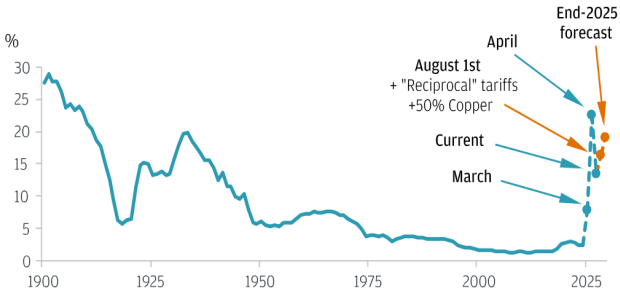
Source: J.P. Morgan Global Economics, using trade basket weights.
Force 2: Geopolitics
The pandemic made viscerally clear what strategic thinkers had warned for years – the US had outsourced not just manufacturing, but resilience. Semiconductor shortages idled auto plants. Property, Plant & Equipment (PP&E) was unavailable when it was most needed. Taiwan, which produces over 60% of the world’s chips and over 90% of the most advanced ones, sits just 180 kms from mainland China. The result is a bipartisan consensus that domestic industrial capacity is a national security imperative, not just an economic preference. This is the most durable of all the forces driving reshoring, because it survives changes in administration.
Force 3: Economics
Chinese wages have risen dramatically since the 2000s. Logistics costs spiked post-COVID and remain structurally elevated. The cost of supply chain disruption, must be priced into every offshoring decision. Add US energy cost advantages, federal incentives, and a narrowing productivity gap (thanks to automation), and reshoring is now rational across a growing range of industries.
Force 4: The Symbolic Moment – A New Refinery After 50 Years
On March 10, 2026, President Trump announced the construction of the first new oil refinery built in the United States in 50 years, located at the Port of Brownsville, Texas. Groundbreaking is scheduled for Q2 2026. For five decades, no one built a greenfield refinery in America. Environmental regulations, permitting complexity, and cheap imports made it irrational. That calculus has reversed. The significance is not merely operational, it is the clearest possible signal of where policy, capital, and political will are now aligned.
PART IV — THE INVESTMENT IMPLICATION: A QUIET ROTATION IN THE S&P 500
The structural shift we are describing has a direct investment corollary, one that is not yet fully priced by markets. Post-2015, the S&P 500 has been a technology index with some other companies attached to it. That is beginning to change.
How We Got Here: Tech’s Dominance Is a Historical Anomaly
In 2000, information technology accounted for roughly 21% of the S&P 500. By early 2025, that figure had risen to approximately 34% and when you include communication services (which houses Alphabet and Meta), the ‘tech complex’ broadly construed accounts for around 45% of the index. Over the same period, energy fell from ~7% to ~3%, near its lowest share in modern history. Materials sit at ~2%. Industrials, the sector most directly tied to physical production, remains at ~8% despite representing the backbone of what the US is now trying to rebuild. These are not small distortions. They reflect a bet by global capital on the primacy of intellectual property over physical capex.
![]()
Table – 1: S&P 500 Sector Weight Evolution & Our Positioning View
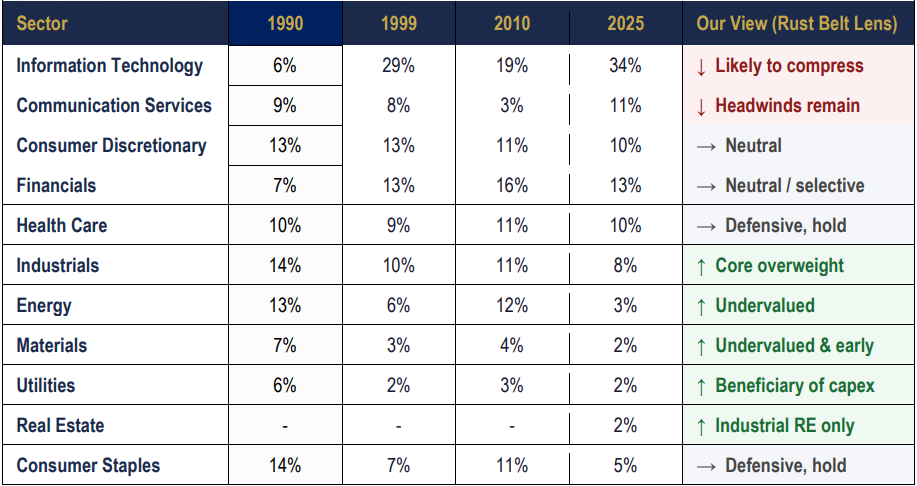
Source: Bloomberg, HDFC TRU. Note: ‘Our View’ reflects medium-term directional thesis, not a short-term trading call.
Figure – 3: Such has been the outperformance of US Tech that excluding the “Magnificent 7,” US equity returns have essentially mirrored those of Europe from the 2020 pandemic low through 2025…
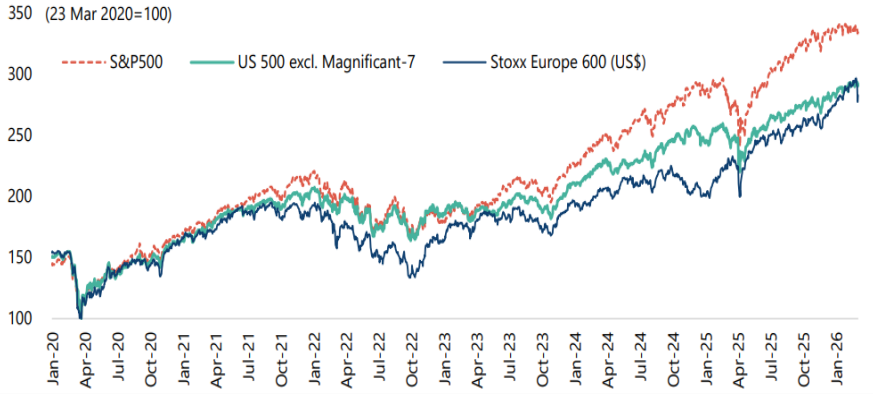
Source: Bloomberg, Greed & Fear Report.
Figure – 4: …We may be on the cusp of a structural shift from Technology toward the Industrials / Resources sector
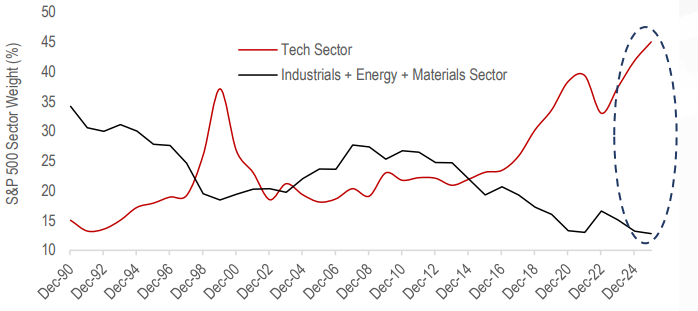
Source: Bloomberg, HDFC TRU.
What Should Outperform in a Rust Belt Renaissance:
▶Industrials & Capital Goods. Companies that supply the machines, systems, and components that reshored factories require. Multi-year capex visibility. Still attractively valued relative to tech (Industrials sector trading at a P/CF of 22x vs. Tech sector at 26x).
▶Energy. The US has a structural surplus of shale oil but ageing refinery capacity. With tariffs protecting domestic producers, integrated US energy companies are direct beneficiaries. Energy at 4% of the S&P is historically underweight.
▶Materials. Steel, copper, aluminium, specialty chemicals – the raw feedstock of industrial production. The reshoring wave is materials-intensive. This sector, at ~2% of the index, has significant rerating potential as industrial activity accelerates.
▶Industrial Real Estate. Warehouses, logistics hubs, manufacturing facilities near reshored supply chains and not the white-collar office or luxury residential real estate of the last cycle, but the unglamorous, highly functional physical infrastructure the new economy requires.
▶Automation & Robotics. The factories returning to America will be automated. Companies in industrial software, robotics, and process automation sit at the intersection of the tech economy and the industrial one and may be the best of both worlds.
What Faces Headwinds:
▶Mega-Cap Technology. Not a call for collapse but at ~45% of the index with valuations embedding significant future growth, the margin for disappointment is thin. A rotation, not a crash, is the more likely scenario.
▶Consumption-Led Consumer Discretionary. Tariff-driven inflation squeezes real purchasing power. Higher landed costs on imported goods reduce margins. The consumer who drove this sector’s outperformance faces a more difficult environment.
▶White-Collar Residential Real Estate. The geography of work is being reshaped. Coastal tech hubs may face slower growth as industrial Midwest cities see renewed investment and population inflows.
THE BOTTOM LINE
Figure – 5: Market leadership is quietly shifting as Industrials, Energy, and Materials begin to pull ahead of Technology and Consumer sectors (re-based to 100)
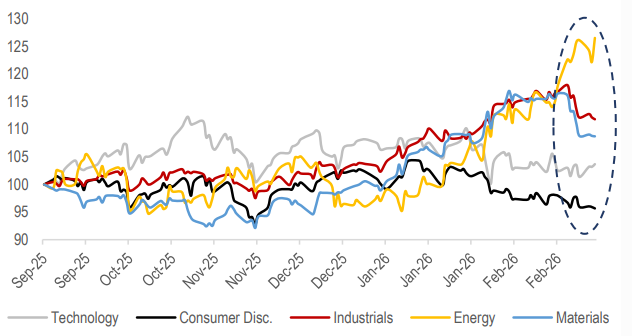
Source: Bloomberg, HDFC TRU. Note: XLK ETF has been used as a proxy for Technology; XLY ETF for Consumer Discretionary, XLI for Industrials, XOP for Oil & Gas E&P and XLB for Materials.
Figure – 6: Global capital allocation is undergoing a structural shift, with investors increasingly rotating away from financial assets and toward real assets (re-based to 100)
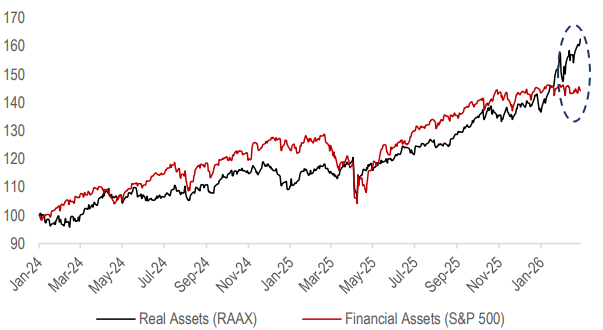
Source: Bloomberg, HDFC TRU. Note: (1) RAAX ETF has been used as a proxy for Real Assets and S&P 500 Index for Financial Assets; (2) Real assets including resource assets: commodities, natural resource equities; income assets: REITs, INVITs; and gold, which includes gold mining equities.


 2024 HDFC TRU