
Foreign Institutional Investors (FIIs) play a crucial role in shaping the Indian equity market, significantly influencing market dynamics, investor sentiment, and economic outlook. Higher FII participation is often seen as a sign of confidence in a country’s economic growth and policy stability. Tracking FII ownership provides key insights into equity market direction.
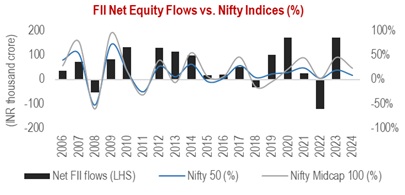
| Correlation | FII Equity Flows |
|---|---|
| Nifty50 | +0.5 |
| Nifty Midcap 100 | +0.4 |
Source: NSE, NSDL. Note: Figures based on calendar year performance.
| Year | Event | Duration (months) | FII outflows (INR cr) | INR Depreciation (%) |
|---|---|---|---|---|
| 2008-09 | Global Financial Crisis | 14 | 59,669 | -23% |
| 2013 | Taper Tantrum | 3 | 23,037 | -14% |
| 2018 | LTCG Tax on Equities, IL&FS Crisis | 9 | 55,919 | -14% |
| 2020 | COVID-19 Pandemic | 2 | 68,857 | -4% |
| 2021-22 | Russia-Ukraine Conflict | 9 | 2,55,879 | -6% |
| 2024-25* | Trump 2.0 | 4 | 1,78,210 | -3% |
Source: Bloomberg, NSDL. Note: CY2025 is priced till 31 Jan 2025.
We don’t think so. While FPI ownership continues to be a key indicator of investor confidence, their influence on the Indian capital markets has slightly moderated post-pandemic. This can be attributed to two major factors:
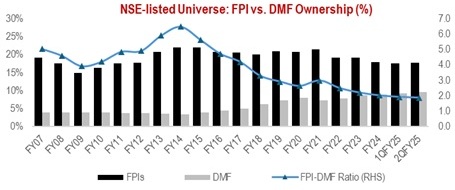
Source: NSE
To assess the resilience of Indian markets post-2020, we examined the relationship between FII volatility and Nifty 50 fluctuations. The findings indicate that the market’s sensitivity to FII outflows has moderated in recent years.
For instance, between Oct-21 and Jun-22 (Russia-Ukraine Conflict), the BSE 500 Index had corrected ~11%, with the cumulative FII outflows during the period at >1% of the BSE 500 Avg. Market Cap. In contrast, during the pre-pandemic periods (2013 and 2018), we observed similar correction in equity markets despite the total FII outflows amounting to <0.5% of the BSE 500 Avg. Market Cap.
| Period | Event | FII net outflows as % BSE 500 Mkt. Cap | % chg. in BSE 500 |
|---|---|---|---|
| Jan’08 – Feb’09 | Global Financial Crisis | 1.4% | -62% |
| Jun’13 – Aug‘13 | Taper Tantrum | 0.4% | -10% |
| Feb’18 – Oct’18 | LTCG Tax on Equities, IL&FS Crisis | 0.4% | -10% |
| Mar’20 – Apr’20 | COVID-19 Pandemic | 0.6% | -13% |
| Oct’21 – Jun’22 | Russia-Ukraine Conflict | 1.1% | -11% |
Source: Bloomberg.
Historically, FII outflows have been influenced by a combination of global/domestic macroeconomic factors, equity valuations, and earnings momentum. However, macroeconomic indicators have been the primary determinant of FII movements.
The below table shows correlations between annual FII flows and the equivalent rate of change in macro-economic factors. A positive correlation indicates that factors tend to move in the same direction and a negative correlation indicates that factors move in different directions.
| Correlation | Net FII Equity Flows |
|---|---|
| DXY Index | -0.5 |
| US 10Y | -0.5 |
| Oil Price | -0.2 |
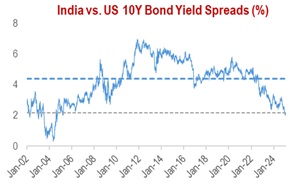
| Bond Yield Spread | 0.3 |
Source: Bloomberg, NSE, NSDL and Investing.com. Data Period: 1 Jan, 2010 to 31 Dec, 2024.
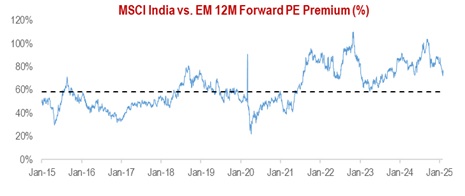
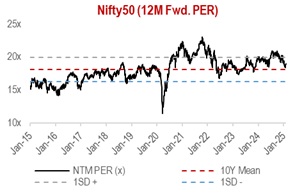
Valuations / Earnings Momentum: Equity valuations have also proven to be an important indicator of flows in the past but have lacked consistency at times. To test the relevance of equity valuations on FII volatility, we looked at the MSCI India 12M forward (NTM) P/E vs. the next 3-month and 6-month average FII equity flows.
| MSCI India 12M Fwd. P/E | Number of Observations | Next 3M Avg. FII flows (INR cr) | Next 6M Avg. FII flows (INR cr) |
|---|---|---|---|
| 8-12x | 9 | 5,589 | 7,158 |
| 12-15x | 62 | 5,712 | 5,822 |
| 15-18x | 71 | 4,884 | 4,994 |
| 18-21x | 50 | 4,229 | 5,111 |
| 21-24x | 35 | 1,216 | 909 |
| >24x | 2 | -16,133 | -25,056 |
FII equity flows retreat, when stocks get too pricey.
Source: Bloomberg. Data Period: 1 Jan, 2006 to 31 Dec, 2024.
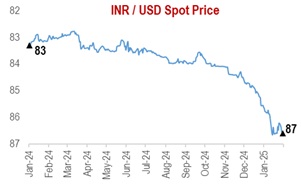
Indian markets experienced significant FII outflows in the past few months, with Oct-24 marking the highest monthly equity outflows to date (Rs 94,017 cr). This trend continued into Jan-25, with more than Rs 175,000 cr being pulled out in the last four months from Indian equity markets. Collectively, these outflows have led to c.10-15% correction in India’s major benchmark indices.
| Earnings Growth (%) | 1QFY24 | 2QFY24 | 3QFY24 | 4QFY24 | 1QFY25 | 2QFY25 |
|---|---|---|---|---|---|---|
| NIFTY 50 | 243 | 246 | 242 | 254 | 288 | 257 |
| Growth (YoY) | 12% | 32% | 24% | 17% | 18% | 4% |
| Growth (QoQ) | 12% | 1% | -2% | 5% | 13% | -11% |
| NIFTY Midcap 100 | 467 | 513 | 496 | 406 | 366 | 358 |
| Growth (YoY) | 25% | 114% | 75% | 12% | -22% | -30% |
| Growth (QoQ) | 29% | 10% | -3% | -18% | -10% | -2% |


Source: Bloomberg, NSDL, Investing.com. Note: Priced as on 31 Jan 2025.
Historically, FII flows have rebounded once key macroeconomic concerns subside, equity valuations normalize, and sustained corporate earnings growth becomes more visible. Since 2002, prolonged net FII outflows for three or more consecutive quarters have occurred only thrice, with most periods witnessing just 1-2 quarters of consecutive outflows.
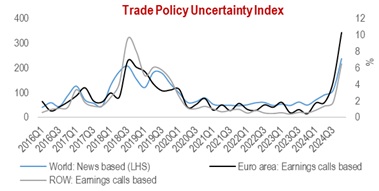
Source: IMF. Note: The uncertainty measures are news-based indices that quantify media attention to an issue, in which a value of 100 corresponds to 1% of news articles that reference the issue.

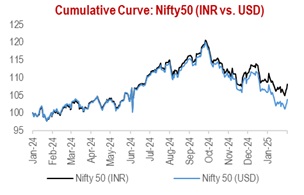
Source: Investing.com, NSE and NSDL.
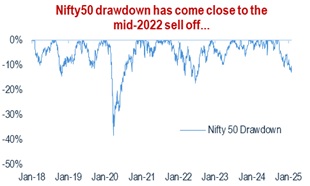
Source: Bloomberg. Note: Priced as on 31 Jan 2025.
FII outflows have weighed on Indian equities in recent months, but historical trends suggest that prolonged outflows are rare, and muted years are typically followed by strong inflows. With 2024 being a subdued year in terms of flows, a strong rebound is expected in 2025. Additionally, macro-economic variables are likely to stabilize in the coming months as markets gain clarity on US policy direction, especially since the DXY Index's current level (>109) has historically been unsustainable. Equity valuations have also become more attractive, with the MSCI India 12M Forward P/E correcting from 24x in September 2024 to ~21x. Given this backdrop, large caps are expected to benefit the most from a potential FII flow reversal, as FIIs typically hold a higher allocation in large caps compared to mid and small caps. The BFSI sector, particularly private banks, stands out as a key beneficiary, given FPIs' significant exposure to financials (~30% as of September 2024). Overall, a large-cap and private banks-focused strategy appears well-positioned to capitalize on the anticipated recovery in FII flows in 2025.
Effective tax planning in corporations can result in significant tax savings. This...
If you are a High Net Worth Individual (HNI), tax planning is important for you....
Real estate is a cornerstone of a diversified portfolio, often endorsed...


 2024 HDFC TRU