
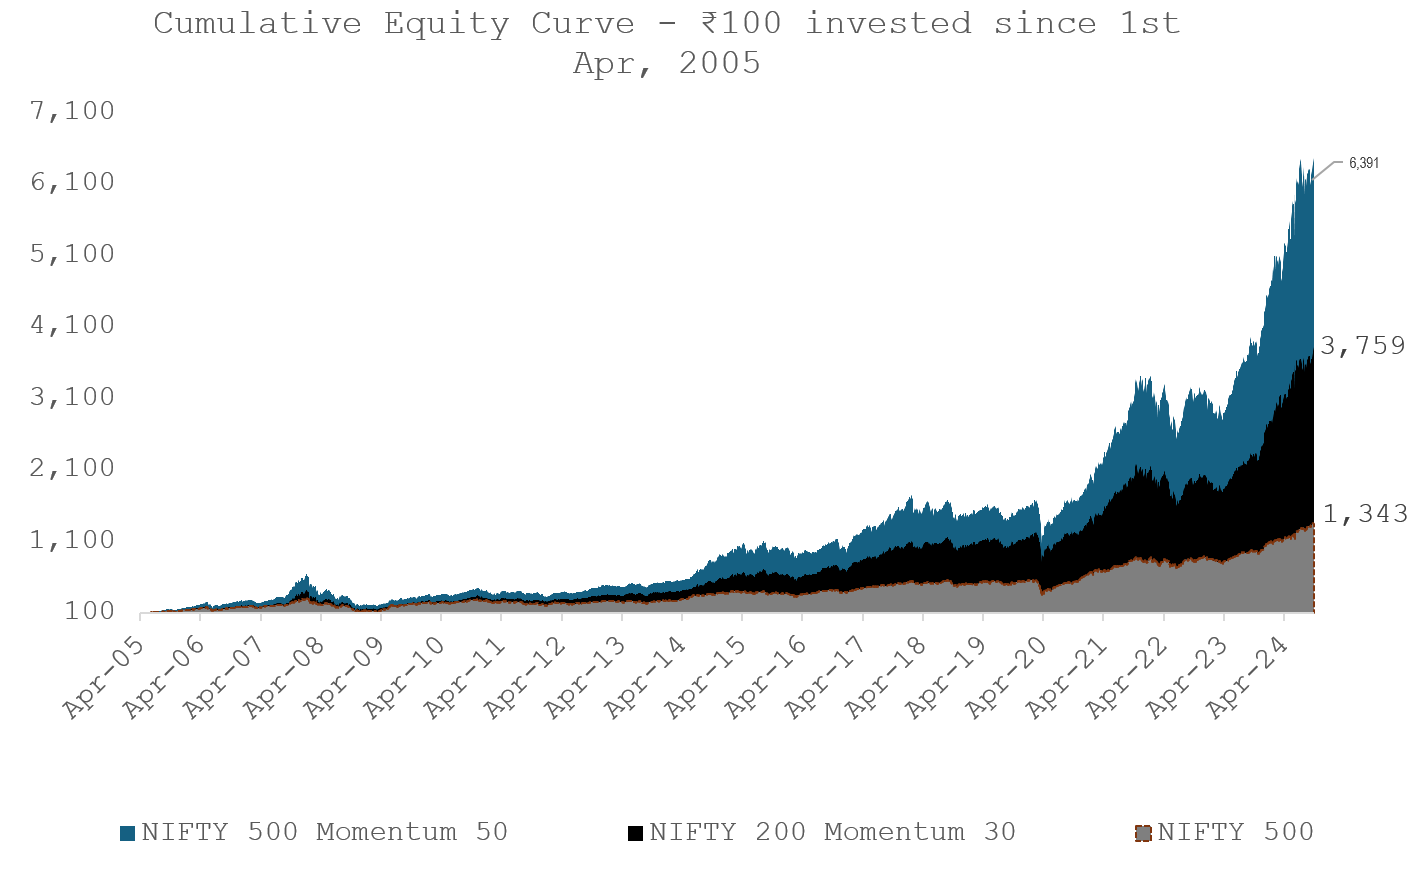
Introduction to Momentum Investing:
However, due to the challenges in obtaining long-term historical data in India, for our analysis we use data starting from 1st April, 2005 and highlight that strong return premiums seen in developed or matured markets also exists in the Indian markets.
Global Evidence of Momentum Strategy:
For instance, the MSCI World Momentum Index has outperformed the MSCI World Index with annualized returns of 11.4% vs. 8.5% since 30th June, 1994 and has also delivered an alpha of >200bps vs. MSCI World over the last 10 years. The MSCI World Momentum Index includes large and mid-cap stocks across 23 Developed Markets (DM) countries.
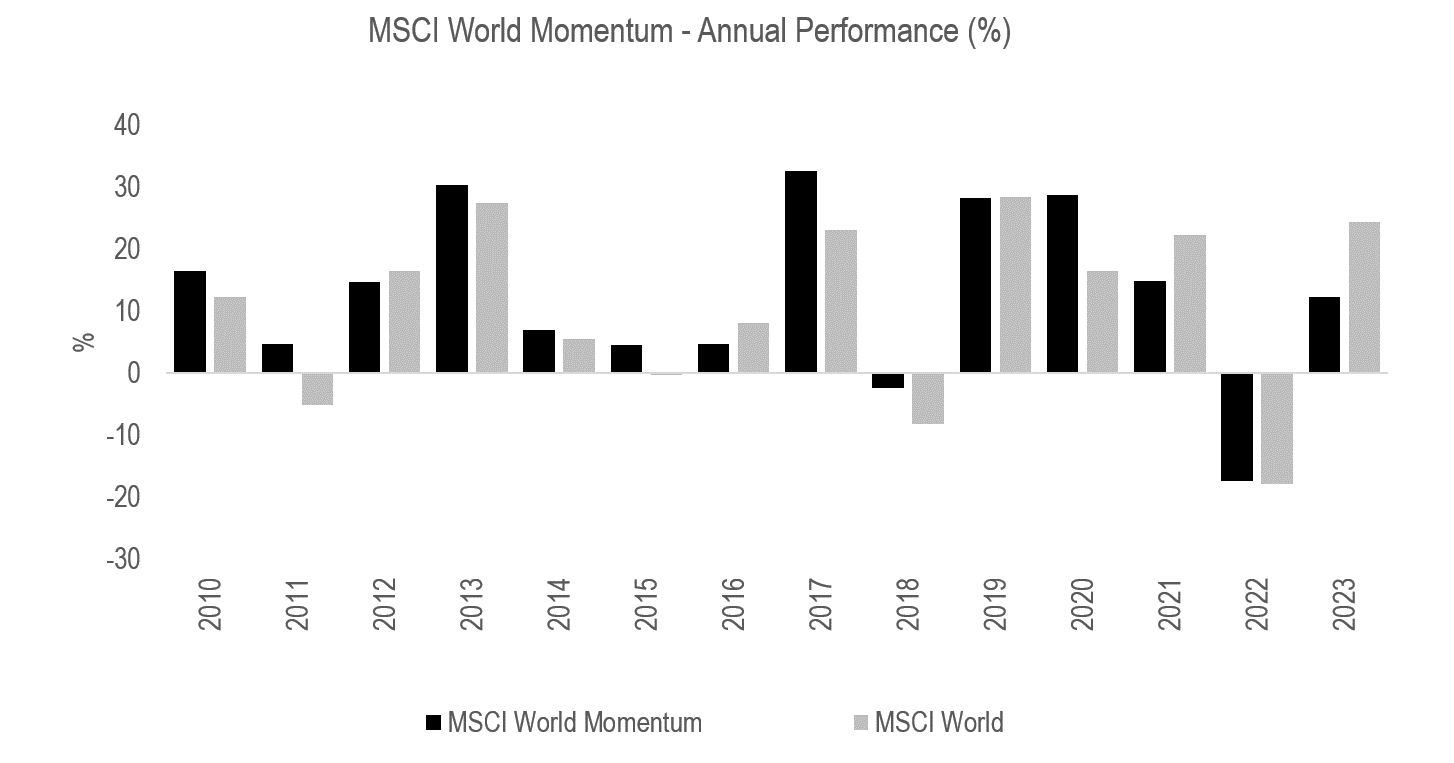
INDEX PERFORMANCE — GROSS RETURNS (%) (SEP 30, 2024)

Source: MSCI Research (here).
Some key snippets from the past globally researched papers and studies by academics and practitioners, which highlights “how and why” momentum works, as below:

What is a Momentum Fund?
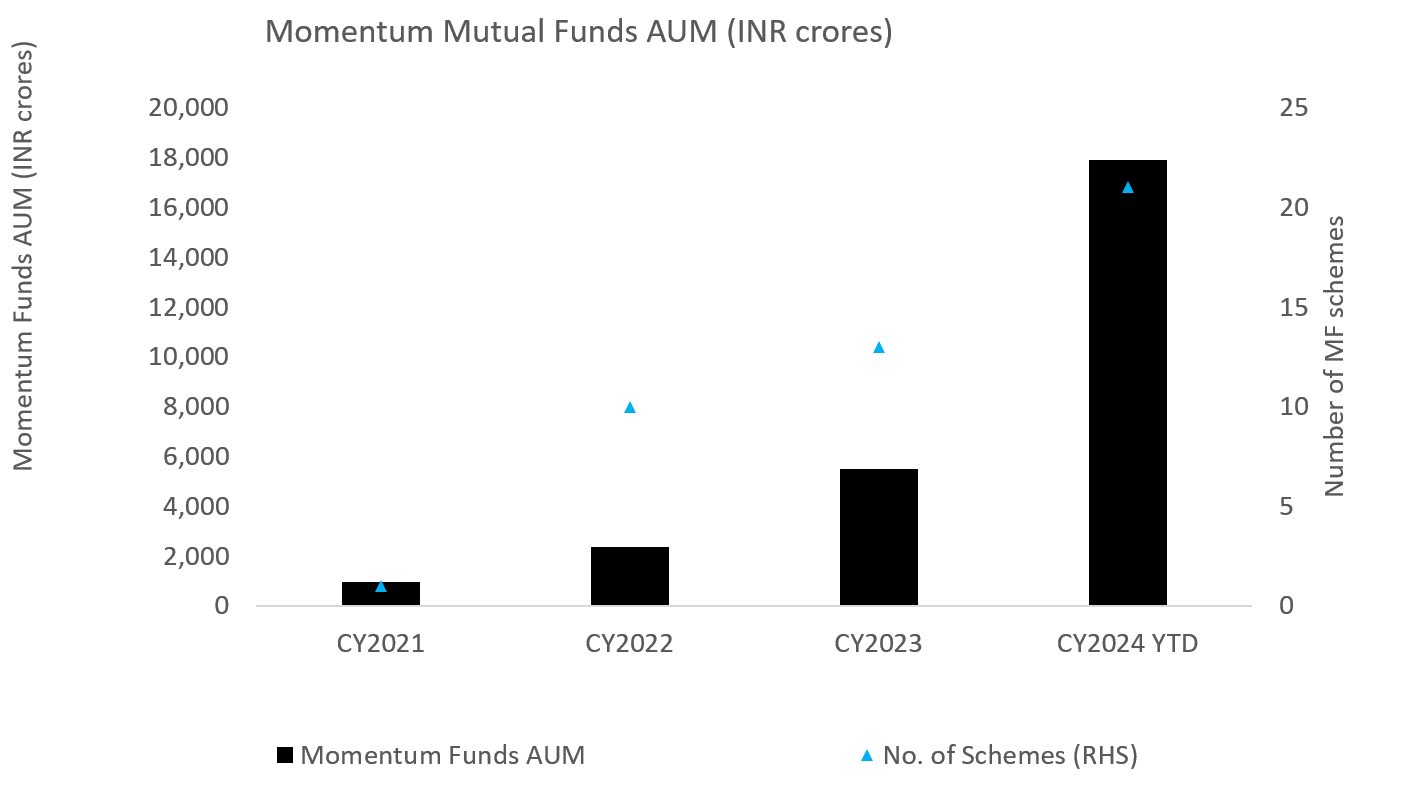
Source: ACE MF. 2024 YTD data as on 30 September, 2024.
Momentum Investing in India:
In India, momentum investing is still relatively new, with only 2 active momentum funds available (Quant and Samco) and the balance 18-19 funds available on the passive side, such as Nifty200 Momentum30 Index and Nifty500 Momentum50 Index.
|
Date |
Calendar Year Annual Returns (%) |
||
|
NIFTY500 Momentum 50 |
NIFTY200 Momentum 30 |
NIFTY500 |
|
|
2006 |
56% |
42% |
34% |
|
2007 |
124% |
96% |
61% |
|
2008 |
-65% |
-60% |
-57% |
|
2009 |
57% |
64% |
83% |
|
2010 |
18% |
17% |
13% |
|
2011 |
-22% |
-18% |
-28% |
|
2012 |
51% |
38% |
32% |
|
2013 |
11% |
11% |
3% |
|
2014 |
68% |
48% |
38% |
|
2015 |
10% |
10% |
-1% |
|
2016 |
-3% |
8% |
3% |
|
2017 |
65% |
53% |
36% |
|
2018 |
-12% |
-2% |
-3% |
|
2019 |
8% |
10% |
7% |
|
2020 |
20% |
19% |
16% |
|
2021 |
76% |
51% |
30% |
|
2022 |
-9% |
-8% |
2% |
|
2023 |
46% |
40% |
25% |
Source: NSE Indices Data; Priced as on 30 September, 2024.
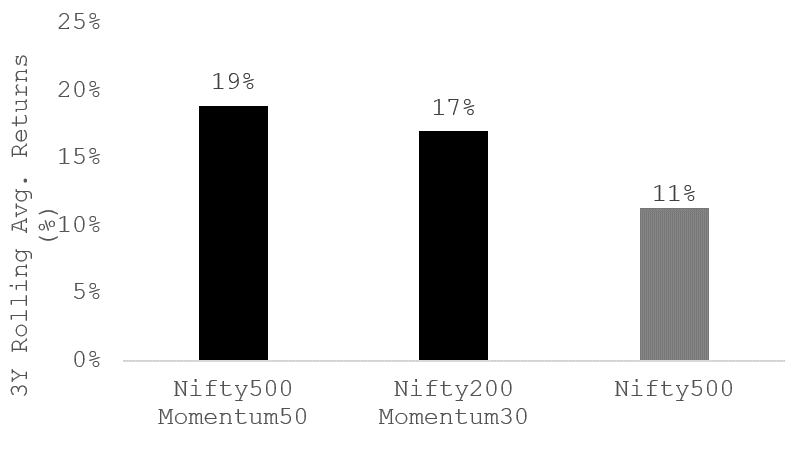
Rolling Returns Performance Analysis of Momentum Indices:
As highlighted above, Momentum Indices have massively outperformed the traditional indices based on point-to-point calendar year returns. Alternatively, we tested the returns performance of these indices on a rolling returns basis – which we feel is a much better metric as it gives a more comprehensive overview by calculating performance over various periods and economic cycles.
Even on rolling returns basis, momentum strategies outperformed the Nifty500 Index.
|
3 Years Rolling Returns |
Nifty500 Momentum 50 |
Nifty200 Momentum 30 |
Nifty500 |
|
Average Returns (%) |
19% |
17% |
11% |
|
Median Returns (%) |
18% |
18% |
12% |
|
% times Rolling Avg. Returns > 15% |
57% |
59% |
34% |
|
% times outperform Nifty500 |
84% |
88% |
|
3 Years Rolling Average Returns – “6,027” Observations:
Source: NSE Indices Data. Data period: April 1, 2005 to Sep 30,2024.
|
5 Years Rolling Returns |
Nifty500 Momentum 50 |
Nifty200 Momentum 30 |
Nifty500 |
|
Average Returns (%) |
18% |
17% |
11% |
|
Median Returns (%) |
20% |
18% |
12% |
|
% times Rolling Avg. Returns > 15% |
69% |
64% |
23% |
|
% times outperform Nifty500 |
97% |
99% |
|
5 Years Rolling Average Returns – “5,297” Observations:

Source: NSE Indices Data. Data period: April 1, 2005 to Sep 30,2024.
Strong Resilience even in Market Downcycles
We also studied the performance of Momentum Index funds during specific bull and bear cycles over the last 20 years.
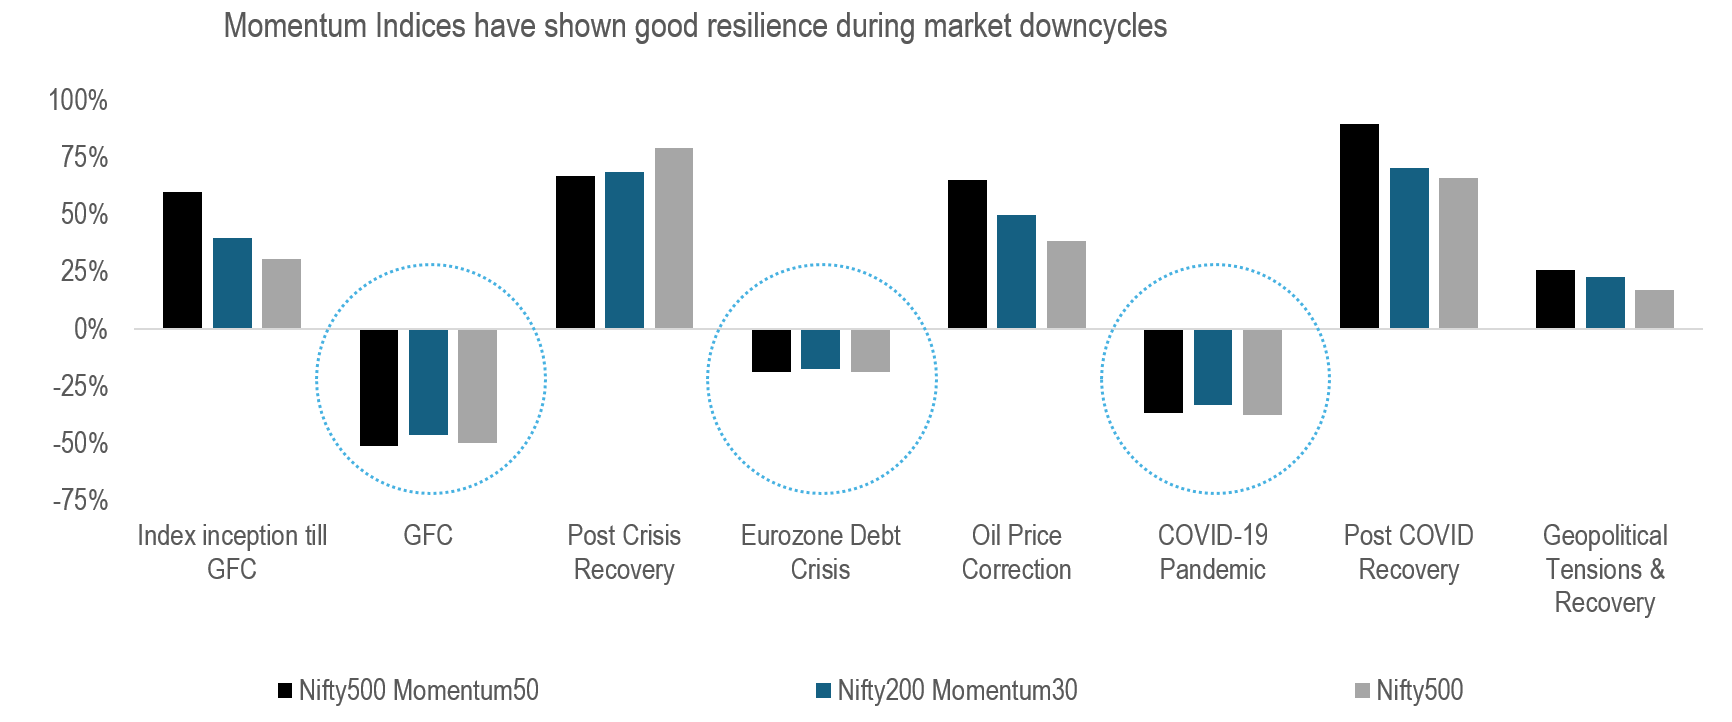
Source: NSE Indices Data.
Note: For the above chart, we have shown absolute returns for cycles which lasted for ≤1 year and CAGR returns for >1 year.
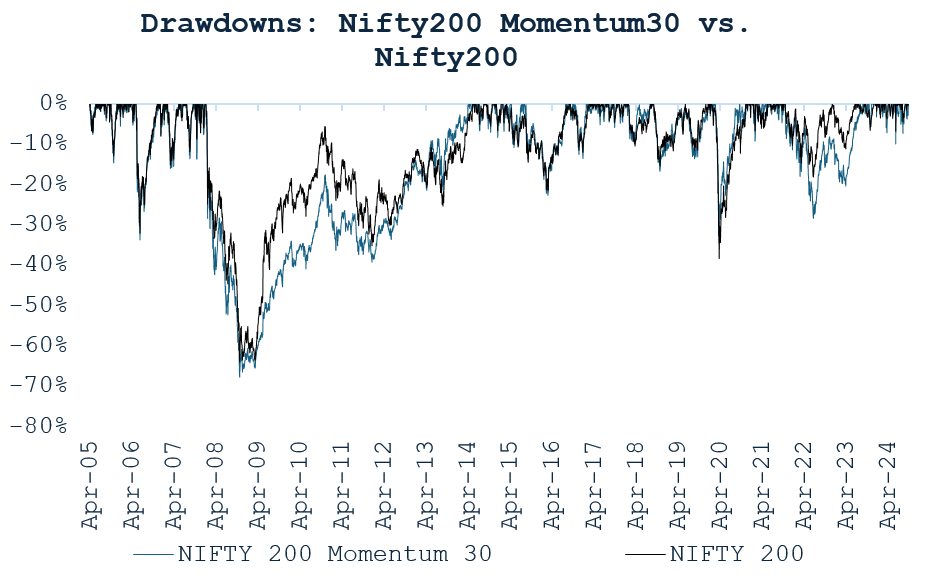
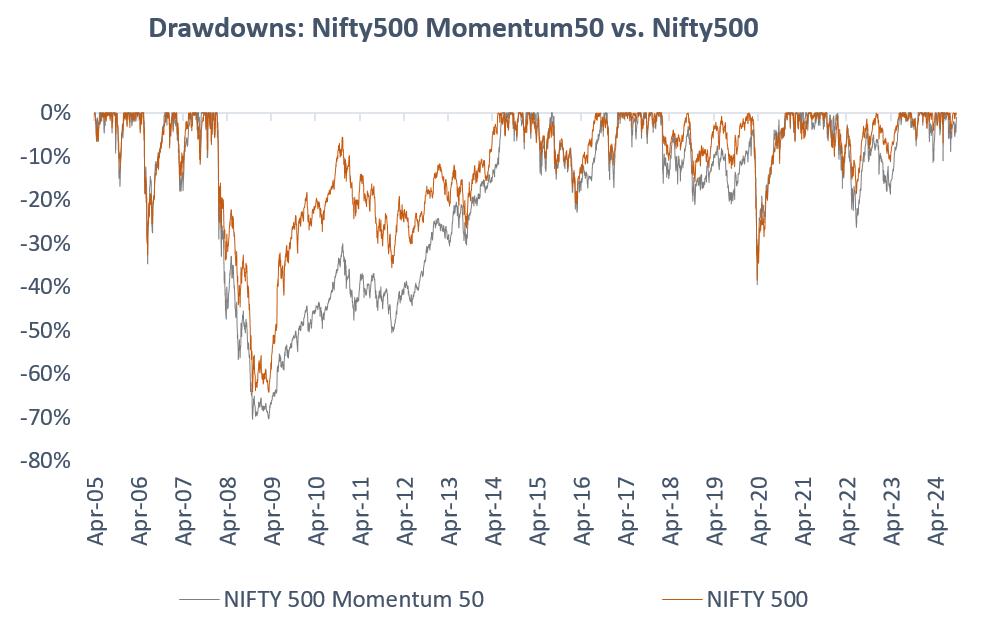
Drawdowns and Risk Evaluation:
While momentum strategies offer superior returns in long bull cycles, they also come with higher volatility and steeper drawdowns (i.e. maximum downside from a previous peak) during sharp market corrections.
Net-net, Momentum is an aggressive investment style and generally has seen a strong & lengthy period of relative underperformance especially when there is sharp change in market cycles.
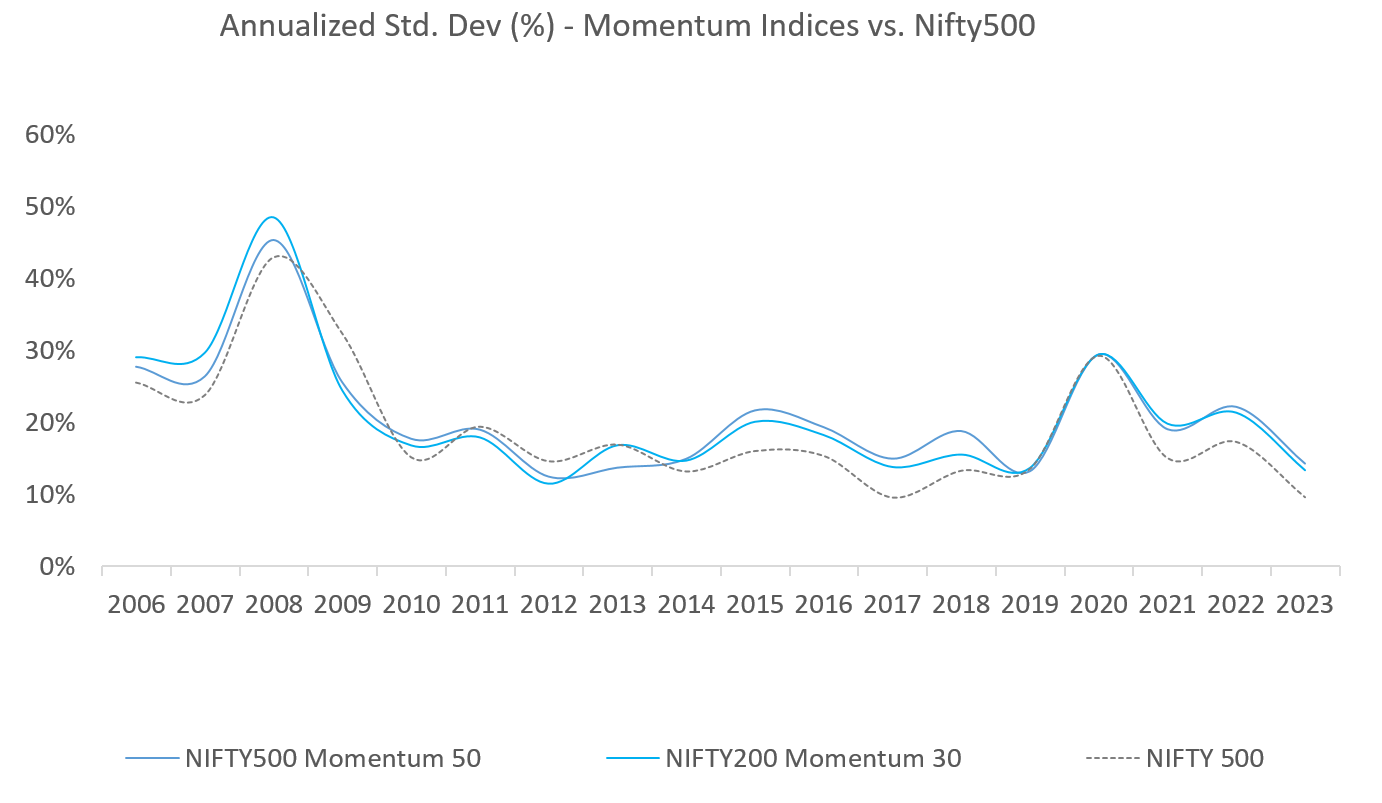
Source: NSE Indices Data.
Note: The annualized Std. Dev is calculated by multiplying the daily std. dev. by
the square root of 250 (assuming 250 trading days in a year).
Source: NSE Indices Data. Data period: April 1, 2005 to Sep 30,2024.
Conclusion:
Effective tax planning in corporations can result in significant tax savings. This...
If you are a High Net Worth Individual (HNI), tax planning is important for you....
Real estate is a cornerstone of a diversified portfolio, often endorsed...


 2024 HDFC TRU